
Part Thirty. Because Puerto Rico’s death toll from 2017’s Hurricane is a metric of economic development, newspapers pressured to up the numbers. For the readers’ convenience, this column of July 12, 2018 is a sample of that pressure.
 UTopiAH. 64 death certificates or 2,975 deaths from a Puerto Rico survey? This is Part 30 of a series for comparing life expectancy, because death rates are the new metric of economic development. Included are medical conditions ranking Utah’s #1 for health. When nose counts didn’t give the answer wanted, the pressure was to turn to surveys, which could be manipulated. A third of the storm deaths were an absence of medical care, no doctors. Where should a memorial be built listing names from the Puerto Rico Hurricane?
Part Thirty. Because Puerto Rico’s death toll from 2017’s Hurricane is a metric of economic development, newspapers pressured to up the numbers. For the readers’ convenience, this column of July 12, 2018 is a sample of that pressure.
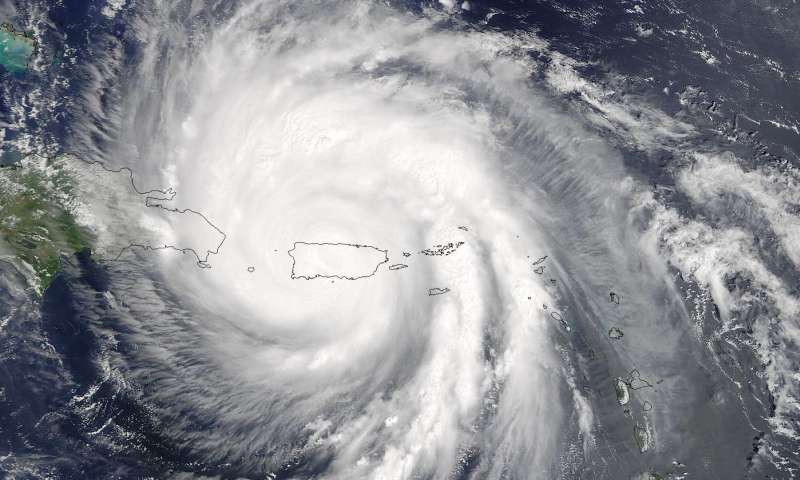
Backstory. In September 2017, two Hurricanes moved, hit, drowned over Puerto Rico. Storms, disasters, commotion bring eyes to the media, boosting ratings. The worse the disaster the better the coverage. Hurricanes destroy by a sea surge, flying debris, and tornadoes. Being warned, the Puerto Ricans population of just under four and a half million sought shelter. Power was lost, homes destroyed, roads blocked. In the weeks afterward, physicians certified 64 storm deaths caused by the storms sea surge, drowning and being struck by wind debris. Each death certificate was completed by a  coroner, with name, gender, description, date, and cause of death. In 2015 28,085 deaths in Puerto Rico were reported on death certificates. See Part 25 for the breakdown of causes in 2015. Unsatisfied, hoping or expecting more deaths, media demanded and pushed for an increase in storm deaths count. In response to the political pressure, the government of Puerto Rico ordered a fresh report. Over the next year, in order to increase the count, the definition for Puerto Rican storm deaths were broadened beyond wind and water, to include suicides, sepsis, dialysis, diabetes, heart attack, and medicine. Of necessity, Puerto Rico’s coroners were declared incompetent to complete death certificates. Also, rather than use the newly incompetent death certificates, each with a deceased’s name, new statistical surveys were used by sampling one in six hundred households, and then multiplying the results by six hundred. No individual names, individual genders or causes, but a new an higher count. The 2018 statistical survey listed storm deaths at 2,975, an accuracy not supported by significant numbers in the survey. The conclusion noted that deaths are a metric of economic activity, and that the increase in storm deaths was due, not to drowning or debris striking, but to failure of the health system, missing doctors, missing ambulances, missing electrical and utility grid. The missing doctors were not due to a failure of the emergency response, but to generations of failure to train doctors, restrictions on medical school seats. Note no one complained about an absence of lawyers, because law schools annually graduate three times the lawyers as medical schools graduate physicians. Likewise no mention regrets a shortage of insurance salesmen, car dealers, handy-men, or other vocations, just health care.
Mortality in Puerto Rico after Hurricane Maria
- Nishant Kishore, M.P.H.,
- Domingo Marqués, Ph.D.,
- Ayesha Mahmud, Ph.D.,
- Mathew V. Kiang, M.P.H.,
- Irmary Rodriguez, B.A.,
- Arlan Fuller, J.D., M.A.,
- Peggy Ebner, B.A.,
- Cecilia Sorensen, M.D.,
- Fabio Racy, M.D.,
- Jay Lemery, M.D.,
- Leslie Maas, M.H.S.,
- Jennifer Leaning, M.D., S.M.H.,
- et al.
- July 12, 2018
N Engl J Med 2018; 379:162-170
DOI: 10.1056/NEJMsa1803972
Abstract
BACKGROUND
Quantifying the effect of natural disasters on society is critical for recovery of public health services and infrastructure. The death toll can be difficult to assess in the aftermath of a major disaster. In September 2017, Hurricane Maria caused massive infrastructural damage to Puerto Rico, but its effect on mortality remains contentious. The official death count is 64.
METHODS
Using a representative, stratified sample, we surveyed 3299 randomly chosen households across Puerto Rico to produce an independent estimate of all-cause mortality after the hurricane. Respondents were asked about displacement, infrastructure loss, and causes of death. We calculated excess deaths by comparing our estimated post-hurricane mortality rate with official rates for the same period in 2016.
RESULTS
From the survey data, we estimated a mortality rate of 14.3 deaths (95% confidence interval [CI], 9.8 to 18.9) per 1000 persons from September 20 through December 31, 2017. This rate yielded a total of 4645 excess deaths during this period (95% CI, 793 to 8498), equivalent to a 62% increase in the mortality rate as compared with the same period in 2016. However, this number is likely to be an underestimate because of survivor bias. The mortality rate remained high through the end of December 2017, and one third of the deaths were attributed to delayed or interrupted health care. Hurricane-related migration was substantial.
CONCLUSIONS
 This household-based survey suggests that the number of excess deaths related to Hurricane Maria in Puerto Rico is more than 70 times the official estimate. (Funded by the Harvard T.H. Chan School of Public Health and others.)
The tropical cyclone Hurricane Maria made landfall in Puerto Rico, a territory of the United States, on September 20, 2017. It compounded the destruction caused by Hurricane Irma 2 weeks earlier, damaging roads and interrupting the water supply, electricity, telecommunications networks, and access to medical care.1-3 Maria caused an estimated $90 billion in damages, making it the third costliest tropical cyclone in the United States since 1900.4 Thousands of persons were displaced from their homes, seeking shelter elsewhere in Puerto Rico or on the mainland United States.5 Accurate estimates of deaths, injuries, illness, and displacement in the aftermath of a disaster such as Hurricane Maria are critical to the immediate response, as well as for future risk reduction and preparedness planning. However, public health surveillance is extremely challenging when infrastructure and health systems are severely damaged.
In early December 2017, the official death count in Puerto Rico stood at 64,6 but several independent investigations concluded that additional deaths attributable to the hurricane were in excess of 1000 in the months of September and October.7-9 According to the Centers for Disease Control and Prevention, deaths can be directly attributed to a tropical cyclone if they are caused by forces related to the event, such as flying debris, or if they are caused by unsafe or unhealthy conditions resulting in injury, illness, or loss of necessary medical services.10 In Puerto Rico, every disaster-related death must be confirmed by the Institute of Forensic Sciences. This requires that bodies be brought to San Juan or that a medical examiner travel to the local municipality to verify the death,11 often delaying the issuance of death certificates. Furthermore, although direct causes of death are easier to assign by medical examiners, indirect deaths resulting from worsening of chronic conditions or from delayed medical treatments may not be captured on death certificates. These difficulties pose substantial challenges for the accurate and timely estimation of official all-cause hurricane-related mortality. The Puerto Rican government has commissioned an external review of the death-registry data as a result of these issues.12,13
In crisis situations, and more routinely for public health planning, official death estimates are often combined with other sources of mortality data, each with their unique set of limitations.14 Records from hospitals, for example, will not include deaths that may have occurred outside health care facilities.15 Representative community-based sampling remains one of the more robust and persuasive approaches to quantifying the effect of disasters and can effectively capture deaths indirectly attributed to disasters.16-18 Despite the limitations and biases associated with data reported by participants, surveys can provide an independent estimate of mortality that does not rely on death-certificate data.19,20
 To this end, we conducted a community-based survey of a representative stratified random sample of 3299 households, of an estimated 1,135,507 total households, across Puerto Rico in early 2018. We compared our survey results with official vital-statistics data for 2016 and calculated excess deaths in Puerto Rico after the hurricane and through December 31, 2017. The survey also assessed the effect of the storm on the infrastructure of the island and on population displacement.
Methods
SAMPLING FRAMEWORK
We conducted a randomized survey of 3299 households from January 17 through February 24, 2018. The target sample of approximately 3000 households was calculated to detect a 50% increase in the annual mortality rate from a historic (September 20 through December 31) baseline rate of 8 per 1000,21 with 80% power at a significance level of 0.05. To ensure sampling of households across geographic regions, we stratified the population according to remoteness, defined according to the travel time to the nearest city with a population of at least 50,000 persons.22,23 We determined an average remoteness index for each of the 900 barrios (administrative units) by using population and road-network data from official government sources.24 Barrios were grouped into eight categories according to percentile from least remote (category 1) to most remote (category 8), and 13 barrios were randomly sampled from each category (Fig. S1 in the Supplementary Appendix, available with the full text of this article at NEJM.org). We randomly sampled an additional barrio from each of the two inhabited island municipalities off the northeast coast, Vieques and Culebra, and excluded largely uninhabited barrios such as nature reserves.
We randomly selected 35 households from each barrio using OpenStreetMap (OSM) layers to identify buildings.25When data collectors encountered an abandoned home or nonhome structure, they sampled a house from all surrounding visible houses using a random number generator. The same process was followed if consent was declined, if the house was empty at the time of the interview, or when sparsely populated barrios had fewer than 35 points sampled because of incomplete data structures on OSM. Our survey logistics did not allow for the data collectors to revisit an empty house (see the Supplementary Appendix for details).
Data collectors did not record any personal identifiers; global positioning system (GPS) coordinates were aggregated after data collection. To avoid coercion and reduce bias, no compensation was provided. The participants were informed that their responses would not result in direct benefits to them or their families. If respondents requested health services, data collectors provided information on accessible resources identified by local partners. Consent for participation was acquired before administration of the survey. This study was granted a human subjects research exemption (45CFR46) by the institutional review board of the Harvard T.H. Chan School of Public Health.
HOUSEHOLD SURVEY
We used a hybrid census method, collecting information about each household member, including all persons who had moved in, moved out, been born, or died in 2017.26 Persons who were reported to be missing from households, but not known to be deceased, were considered to be alive for our calculations. Households were defined as a person or a group of persons, related or unrelated, who live together. The survey was administered to one adult respondent per household and took less than 10 minutes to complete. The survey instrument is
provided in the Supplementary Appendix. The survey included questions on age, sex, cause of death if after the hurricane, hurricane-related migration, neighborhood deaths, and access to electricity, water, and cellular network coverage on an ordinal scale for each month (0 days, 1 to 7 days, 8 to 14, 15 to 30 days, or all month).
POPULATION ESTIMATION
Survey weights (w) were constructed by calculating the inverse probability of selection of a household and were defined as
Whousehold = households in barrio / households in sample in barrio
and
Wbarrio = population in remoteness category / population in barrio in remoteness category
We used the following formulas to calculate the general population estimate:
weighted household size = Whousehold * Wbarrio * 1 / no. of barrios in remoteness category.
Ard
Sigma I = 1 to no. of households, weighted household sizei,
Where I is the household. Weights and estimates of excess deaths were constructed with the use of the most recent official population estimate of 2016. 27
STATISTICAL ANALYSIS
To estimate excess deaths, we estimated the mortality rate after the hurricane (from September 20 through December 31, 2017) and compared it with the official mortality rate for the same period in 2016, since mortality rates showed seasonal but stable trends from 2010 through 2016 (Fig. S2 in the Supplementary Appendix). Official monthly mortality data for 2016 were obtained from the Department of Health 2016 mortality data provided by the Institute of Statistics of Puerto Rico.28 We computed our rate without applying survey weights, since we observed no remoteness category–specific clustering of deaths (see the Supplementary Appendix for further discussion). The post-hurricane unweighted crude mortality rate (Rafter), estimated from our survey, was therefore defined as where 102 is the number of days between September 20 and December 31, and Rbefore is the unweighted crude mortality rate in 2017 before September 20. The standard error for Rafter was estimated from our survey:
 We assumed deaths were Poisson distributed, and we calculated the corresponding 95% confidence interval assuming the rate would be large enough that we could assume the normal approximation for the Poisson distribution:
All rates were reported as deaths per 1000 persons. To estimate excess deaths from September 20 through December 31, 2017, we calculated the difference between the estimated Rafter and the rate for the same period in 2016. Excess deaths were estimated by the application of this rate difference to the 2016 baseline population estimates for Puerto Rico obtained from the American Community Survey (ACS) (conducted annually by the Census Bureau), as follows: excess deaths=Rdiff×(population×102/365). By definition, the calculations include a mortality rate of 0 for single-person households (because of survivor bias; see the Supplementary Appendix for details). Therefore, we also calculated a per-household-size annualized mortality rate for before and after the hurricane, and we made a simple adjustment to our estimated mortality rate assuming that persons in one-person households had the same annualized death rate as in 2016 and to reflect household size distributions (see the Supplementary Appendix). We have made all the anonymized data, analysis, and code for generating our figures, as well as a version of this article in Spanish, available at https://github.com/c2-d2/pr_mort_official.
Results
DEMOGRAPHIC CHARACTERISTICS OF THE SURVEY POPULATION
Figure 1. Age Distribution and Household Size.
We sampled 3299 households composed of 9522 persons. Of all those approached, 93.4% of households provided consent and completed a full survey. To assess the representativeness of our survey population, we compared its demographic composition with the data for Puerto Rico from the 2016 ACS. On average, persons in our survey were older and households were larger than the ACS 2016 baseline (Figure 1, and Fig. S3 and Table S1 in the Supplementary Appendix). We generally observed no significant difference in the sex ratios; however, in our household sample, a higher percentage (54%; 95% confidence interval [CI], 49.9 to 58.5) of women moved out of their households. Using our survey weights, we estimated the population size of Puerto Rico to be 3,030,307 persons (95% CI, 1,466,680 to 4,593,934). Given the widely reported out-migration from Puerto Rico due to the hurricane, this population estimate is roughly consistent with the Population Estimates Program statistic of 3,406,520 in 201627 and provides evidence in support of the representative nature of our sampling method.
POPULATION DISPLACEMENT
Figure 2. Age Distribution of Persons Who Left Households in 2017, as Compared with Those Who Remained.
The survey identified substantial population displacement, attributed to Hurricane Maria by the respondents (Figure 2). A total of 268 persons (2.8% of the sampled population) were reported to have left households because of the hurricane. The median age of those who left and did not return, or were missing, was 25 years, as compared with a median age of 50 among those staying or dying in the household. Of those who left because of the hurricane, the majority (52%) moved elsewhere within Puerto Rico, but many (41%) went to parts of the mainland United States. A total of 521 persons (5.5% of the sampled population) were reported to have moved into the surveyed households because of the hurricane. The percentage of households that could not be surveyed (because of abandonment or other issues) increased in more remote regions (Fig. S4 in the Supplementary Appendix). Men and women did not migrate at significantly different rates, and there was no clear association between migration and remoteness.
Age Distribution of Persons Who Left Households in 2017, as Compared with Those Who Remained.
LOSS OF SERVICES
Figure 3. Number of Days without Basic Services and Disruption of Medical Services.
We found a strong positive association between remoteness and the length of time without electricity, water, or cellular telephone coverage (Figure 3A). On average, households went 84 days without electricity, 68 days without water, and 41 days without cellular telephone coverage after the hurricane and until December 31, 2017. In the most remote category, 83% of households were without electricity for this entire time period (Table S2 in the Supplementary Appendix). The distributions around these estimates were often bimodal (Fig. S5 in the Supplementary Appendix), particularly in remote regions, which suggests that households either recovered services relatively quickly or not for several months. Many survey respondents were still without water and electricity at the time of sampling, a finding consistent with other reports.8
Considerable disruptions to medical services were reported (Figure 3B) across all categories irrespective of remoteness, with 31% of households reporting an issue (Table S3 in the Supplementary Appendix). The most frequently reported  problems were an inability to access medications (14.4% of households) and the need for respiratory equipment requiring electricity (9.5%), but many households also reported problems with closed medical facilities (8.6%) or absent doctors (6.1%). In the most remote category, 8.8% of households reported that they had been unable to reach 911 services by telephone.
- Estimates of Excess Deaths and Reported Causes of Death.
EXCESS DEATHS
Figure 4. Estimates of Excess Deaths and Reported Causes of Death.
We calculated a 62% increase in the mortality rate from September 20 through December 31 in 2017 as compared with the same period in 2016, corresponding to an annual mortality rate of 14.3 deaths (95% CI, 9.8 to 18.9) per 1000 persons and an estimated 4645 excess deaths (95% CI, 793 to 8498) (Table S4 in the Supplementary Appendix). Figure 4A shows the relationship between our estimates and other reports. We did not find a large or significant correlation between remoteness and the annualized death rate, and evaluation of reported death rates among neighbors mirrored our mortality estimates according to remoteness category (Table S5 and Fig. S6 in the Supplementary Appendix). Increases in post-hurricane death rates were observed across age groups and were not a reflection of the migration of younger persons out of Puerto Rico after the disaster (Table S6 in the Supplementary Appendix). Because we could not survey single-person households in which a death had occurred (see the Supplementary Appendix), we adjusted our estimate by using the 2016 mortality rate for single-person households. Our adjustment for this survivor bias and household-size distribution resulted in a post-hurricane estimate of 5740 excess deaths (95% CI, 1506 to 9889) (see the Supplementary Appendix, including Table S7).
- Figure 4Bshows the age of the 56 persons who died, as reported in our survey, as well as the reported causes and timing of the deaths; 18 deaths occurred before September 20, 2017, and 38 after the hurricane. Approximately one third of post-hurricane deaths were reported by household members as being caused by delayed or prevented access to medical care (see survey question 3c in the Supplementary Appendix), and nearly 1 in 10 was attributed directly to the hurricane by respondents (Table S8 in the Supplementary Appendix). Although we were unable to validate this attribution, it is consistent with the substantial disruptions to medical services that have been reported more generally (Figure 3B).
Discussion
- Our results indicate that the official death count of 64 is a substantial underestimate of the true burden of mortality after Hurricane Maria. Our estimate of 4645 excess deaths from September 20 through December 31, 2017, is likely to be conservative since subsequent adjustments for survivor bias and household-size distributions increase this estimate to more than 5000. These adjustments represent one simple way to account for biases, but we have made our data publicly available for additional analyses. Our estimates are roughly consistent with press reports that evaluated deaths in the first month after the hurricane.8,29-33Our estimates also indicate that mortality rates stayed high throughout the rest of the year. These numbers will serve as an important independent comparison to official statistics from death-registry data, which are currently being reevaluated,13,34and underscore the inattention of the U.S. government to the frail infrastructure of Puerto Rico.
- In the United States, death certificates are the primary source of mortality statistics, and in most jurisdictions, death can be attributed to disasters only by medical examiners.10,35Survey-based studies can therefore provide important complementary population-level metrics in the wake of natural disasters, despite inherent limitations associated with the nature of participant-reported data, recall bias, nonresponse bias, and survivor bias.15,36 To address recall bias and errors in participant-reported data in our survey, the questions were kept simple, and the recall periods short. Given the salience of a death in a household, it is unlikely that respondents did not report deaths accurately, but recall bias may have affected other parts of the survey. The nonresponse rate was less than 7%.
- In our survey, interruption of medical care was the primary cause of sustained high mortality rates in the months after the hurricane, a finding consistent with the widely reported disruption of health systems.37Health care disruption is now a growing contributor to both morbidity and mortality in natural disasters.15,38,39 In the United States, this phenomenon has been observed in the aftermaths of Hurricane Katrina, Superstorm Sandy, and more recently Hurricanes Harvey and Irma, in which nursing home residents and those dependent on life-sustaining equipment were disproportionately affected.40 Growing numbers of persons have chronic diseases and use sophisticated pharmaceutical and
 mechanical support that is dependent on electricity. Chronically ill patients are particularly vulnerable to disruptions in basic utilities, which highlights the need for these patients, their communities, and their providers to have contingency plans during and after disasters.41
 - The timely estimation of the death toll after a natural disaster is critical to defining the scale and severity of the crisis and to targeting interventions for recovery.15,26The disaster-relatedness of deaths has additional importance for families because it provides emotional closure, qualifies them for disaster-related aid, and promotes resiliency.10 Although the government of Puerto Rico stopped sharing mortality data with the public in December 2017 (our request for these data was also denied), in April 2018 the Institute of Statistics of Puerto Rico, an autonomous government entity, adopted a resolution to improve the counting of disaster-related deaths and publish all mortality data online without further delay. As the United States prepares for its next hurricane season, it will be critical to review how disaster-related deaths will be counted, in order to mobilize an appropriate response operation and account for the fate of those affected.
- Supported by theHarvard T.H. Chan School of Public Health, the Harvard François-Xavier Bagnoud Center for Health and Human Rights, the Department of Epidemiology at the Harvard T.H. Chan School of Public Health, the Emergency Medicine Department at Beth Israel Deaconess Medical Center, and the Section of Wilderness and Environmental Medicine at the Department of Emergency Medicine, University of Colorado School of Medicine.
- Disclosure formsprovided by the authors are available with the full text of this article at NEJM.org.
- Balsari and Buckee contributed equally to this article.
- This article was published on May 29, 2018, at NEJM.org.
- We thank the graduate students at Carlos Albizu University and Ponce Health Sciences University who conducted the survey, and OpenStreetMap (OSM) contributors. OSM data are available under the Open Database License, and the cartography is licensed as CC BY-SA (seeopenstreetmap.org/copyright).
- From the Departments of Epidemiology (N.K., A.M., C.O.B.), Social and Behavioral Sciences (M.V.K.), and Biostatistics (R.A.I.) and the Center for Communicable Disease Dynamics (N.K., A.M., C.O.B.) and the François-Xavier Bagnoud Center for Health and Human Rights (A.F., J. Leaning, S.B.), Harvard T.H. Chan School of Public Health, Harvard University, the Department of Emergency Medicine, Beth Israel Deaconess Medical Center and Harvard Medical School (F.R., S.B.), and the Department of Biostatistics and Computational Biology, Dana–Farber Cancer Institute (R.A.I.) — all in Boston; the Department of Psychology, Carlos Albizu University (D.M., I.R.), and the Puerto Rico Science, Technology, and Research Trust (L.M.) — both in San Juan; Keck School of Medicine, University of Southern California, Los Angeles (P.E.); and the Section of Wilderness and Environmental Medicine at the Department of Emergency Medicine, University of Colorado School of Medicine, Aurora (C.S., J. Lemery).
Disclaimer: The author of each article published on this web site owns his or her own words. The opinions, beliefs and viewpoints expressed by the various authors and forum participants on this site do not necessarily reflect the opinions, beliefs and viewpoints of Utah Standard News or official policies of the USN and may actually reflect positions that USN actively opposes. No claim in public domain or fair use. © Edmunds Tucker.
Utah Standard News depends on the support of readers like you.
Good Journalism requires time, expertise, passion and money. We know you appreciate the coverage here. Please help us to continue as an alternative news website by becoming a subscriber or making a donation. To learn more about our subscription options or make a donation, click here.
To Advertise on UtahStandardNews.com, please contact us at: ed@utahstandardnews.com.
Comments - No Responses to “Part Thirty. Because Puerto Rico’s death toll from 2017’s Hurricane is a metric of economic development, newspapers pressured to up the numbers. For the readers’ convenience, this column of July 12, 2018 is a sample of that pressure.”
Sure is empty down here...