
Part 83 United States Drug Enforcement Administration Releases 2015 National Drug Threat Assessment Summary Methamphetamine. Mexico. Smuggling. Deaths Traffic crashes, seizures, or heart attacks. DEA ICE FDA
[2015 Drug ThreatAssessment Continued from Part 82 Fentanyl]
DEA Releases 2015 Drug Threat Assessment Methamphetamine
Methamphetamine (U) Map 7. Percentage of NDTS Respondents Reporting High Methamphetamine Availability, 2008 – 2011, Source: National Drug Threat Survey
The US Drug Enforcement Administration 2015 National Drug Threat Assessment (NDTA) is a comprehensive report of the threat posed to the United States by the trafficking and abuse of illicit drugs, the nonmedical use of CPDs, [Controlled Prescription Drugs] , money laundering, TCOs [Transnational Criminal Organization] , gangs , smuggling, seizures, investigations, arrests, drug purity or potency, and drug prices, in order to provide the most accurate data possible to policymakers, law enforcement authorities, and intelligence officials.
Part 83 United States Drug Enforcement Administration Releases 2015 National Drug Threat Assessment Summary Methamphetamine. Mexico. Smuggling. Deaths Traffic crashes, seizures, or heart attacks.
Overview Methamphetamine
Methamphetamine seizures, survey data, price and purity data, and law enforcement reporting indicate methamphetamine continues to be readily available throughout the United States. Use data remains stable while treatment data increased slightly in 2012. Most of the methamphetamine available in the United States is clandestinely produced in Mexico and smuggled across the Southwest Border. Domestic production continues to occur at much lower levels than Mexico, and seizures of domestic methamphetamine laboratories have declined, most likely due to the high availability of high-purity, high-potency Mexican methamphetamine.
(U) Table 9: DEA Field Division Reporting of Methamphetamine Availability in the First Half of 2014 and Comparison to Previous Period
Availability Compared to Second Half 2013
Availability During First Half 2014
Field Division
Atlanta Field Division High Stable
Caribbean Field Division Moderate Stable
Chicago Field Division High More
Dallas Field Division High Stable
Denver Field Division High Stable
Detroit Field Division Moderate Stable
El Paso Field Division Moderate More
Houston Field Division High Stable
Los Angeles Field Division High Stable
Miami Field Division Moderate Stable
New England Field Division Low Stable
New Jersey Field Division Low Stable
New Orleans Field Division High Stable
New York Field Division Low Stable
Philadelphia Field Division Low Stable
Phoenix Field Division High More
San Diego Field Division High Stable
San Francisco Field Division High More
Seattle Field Division High Stable
St. Louis Field Division High Stable
Washington Field Division Low Stable
Availability Methamphetamine
Methamphetamine availability continues to increase in the United States. According to the 2015 NDTS, 33 percent of responding agencies reported that methamphetamine was the greatest drug threat in their areas. (See Map A9 in Appendix A.) Additionally, 42.2 percent of the respondents reported methamphetamine was highly available, meaning the drug is easily obtained at any time. NDTS respondents also reported methamphetamine as the drug that most contributes to both violent crime (38.2 %) and property crime (33.4 %). (See Maps A12 and A13 in Appendix A and Tables B6 and B7 in Appendix B.) DEA FDs, NDTS respondents, and laboratory reporting indicates high availability of methamphetamine throughout the United States. (See Map 7 and Table B8 and B9 in Appendix B.)
• In 2014, most DEA FDs reported methamphetamine availability was high and availability was stable compared to the previous reporting period. The Chicago, El Paso, Philadelphia, and San Diego FDs reported higher availability in 2014. (See Table 9.)
• Methamphetamine reports to the National Forensic Laboratory Information System (NFLIS) increased 14.8 percent between 2012 (180,187 reports) and 2013 (206,784 reports). In addition, methamphetamine reports increased significantly—53.3 percent—since 2009 (134,891 reports).
• Methamphetamine seizures continue to increase along the Southwest Border. According to CBP, seizure statistics indicate that methamphetamine seizures along the Southwest Border increased 20 percent from calendar year (CY) 2013 to CY 2014. In addition, seizures increased in each corridor along the Southwest Border. (See Map 8.) The majority (61%) of methamphetamine seizures in 2014 occurred in California; 23 percent occurred in Texas.
(U) DEA’s Methamphetamine Profiling Program
The DEA Methamphetamine Profiling Program (MPP) provides an in-depth chemical analysis of selected methamphetamine samples to establish trends associated with the manufacture of methamphetamine seized primarily in the United States. The MPP further establishes the method used to manufacture methamphetamine, as well as tracks purity levels and other related trends. However, the MPP is unable to determine the source origin of methamphetamine samples because the drug is synthetically produced, unlike morphine and cocaine, which are extracted from organic sources. It should also be noted that the MPP data set is only reflective of the MPP sampling plan, and is not representative of all methamphetamine samples submitted to the DEA laboratory system.
Purity and Potency Methamphetamine
The DEA Methamphetamine Profiling Program (MPP) purity and potencyxx results for recent methamphetamine samples obtained from the US–Mexico Border remain high, indicating the continued availability of high quality methamphetamine.
Purity is defined as a measure of the amount of an illicit substance present in a sample compared to other substances in the sample such as adulterants, diluents, or solvents. Potency is defined as the measure of drug activity in terms of the dosage required to exert an effect on the body.
Use Methamphetamine
The threat from methamphetamine use is persistent. While national use survey data appear to be stable, national treatment data as well as localized public health officials, indicate methamphetamine use may be increasing. The number of methamphetamine-related treatment admissions was 6.5 percent higher in 2012 than following a seven-year decline.
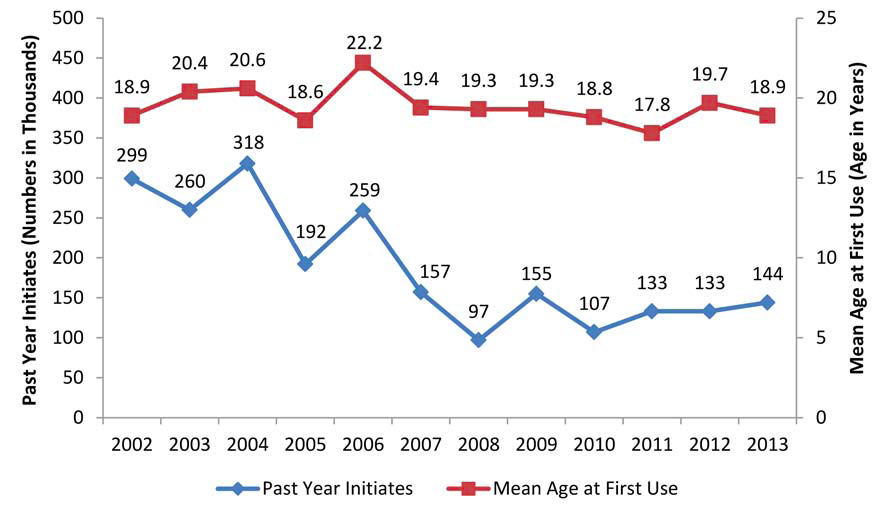
• According to NSDUH, there has been a steady increase in the last four years in the number of past year users of methamphetamine, as well as the number of new users. In 2013, the number of past year users, which includes new initiates and current users, was 1,186,000, up from 1,155,000 in 2012. The number of past year methamphetamine initiates ages 12 or older was 144,000 in 2013. However, these numbers remain significantly lower than estimates from 2002 to 2006. The average age at first use was 18.9, which has remained relatively stable since 2002. (See Chart 21.)
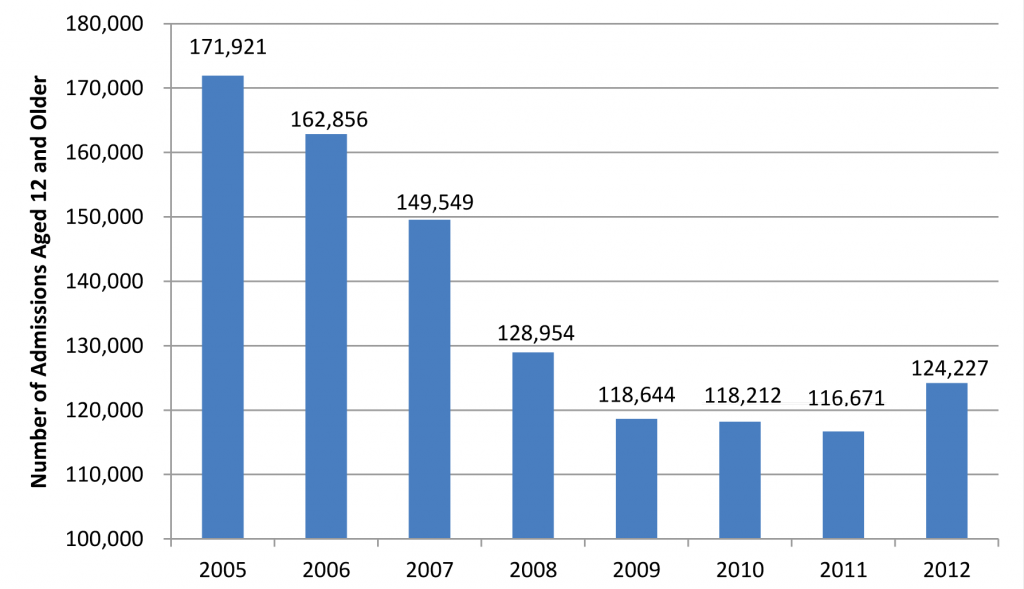
• TEDS data indicate the number of methamphetamine-related treatment admissions increased to 124,227 in 2012. However, this increase follows a steady decrease that occurred between 2005 and 2011. (See Chart 22.)
(U) Map 8. CBP Methamphetamine Seizures by Southwest Border Corridor in 2014, with Percent Change from 2013
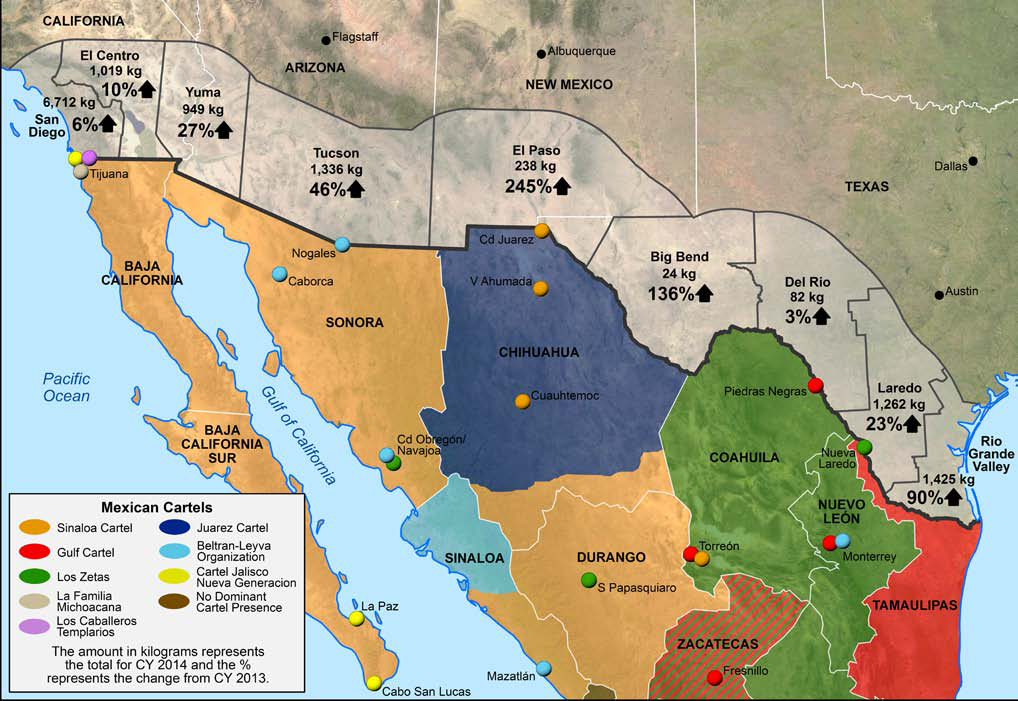
Methamphetamine threat levels are much higher in the western United States. According to the 2015 NDTS, the OCDETF regions with the largest number of respondents ranking methamphetamine as the greatest drug threat were the Southwest (69.7%), West Central (66.5%), and Pacific (55.4%) regions.
• According to the Oregon State ME Office, the number of methamphetamine-related deaths in that state increased 32 percent from 2012 to 2013. More than 55 percent of all drug-related deaths in Oregon were associated with methamphetamine use. However, the ME Office noted the majority of the methamphetamine-related deaths were not overdoses, but related to other events, such as traffic crashes, seizures, or heart attacks. Additionally, TEDS data indicate Oregon had 210 per 100,000 methamphetamine treatment admissions, which is well above the national average of 47 per 100,000 people.
• According to the San Diego County ME 2013 Annual Report (the most recent year available), methamphetamine is the number one cause of drug/medication-related deaths. There was a 34 percent increase in the number of unintentional deaths caused by methamphetamine between 2012 (142) and 2013 (190).
(U) Chart 21. Past Year Methamphetamine Initiates among Persons Aged 12 or Older and Mean Age at First Use of Methamphetamine among Past Year Initiates Aged 12 to 49: 2002 – 2013 Source: National Survey on Drug Use and Health
U) Chart 22. Methamphetamine Primary Admissions to Publicly Funded Treatment Facilities Source: Treatment Episode Data Set
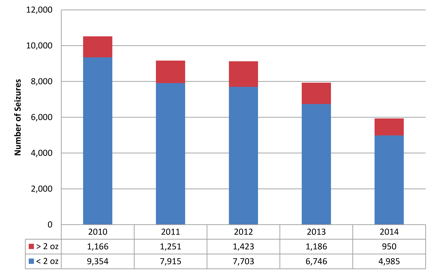
(U) Chart 23. Number of Methamphetamine Laboratories Seized, by Capacity, 2010 – 2014 Note: These seizures are laboratory seizures only and do not include chemical and dumpsite seizures.
Source: EPIC National Seizure System as of March 31, 2015
Methamphetamine use levels may be increasing as some cocaine users may be switching to methamphetamine when cocaine is unavailable. Cocaine availability has diminished in recent years and methamphetamine (also a stimulant) can serve as a cheaper and more potent alternative to cocaine. Some distributors sell both drugs.
The DEA Atlanta, Philadelphia, and St. Louis FDs report cocaine distributors are now selling methamphetamine to supplement their income from diminishing cocaine supplies.
Production Methamphetamine
Production in Mexico
Most of the methamphetamine seized in the United States is clandestinely produced in Mexico and smuggled across the Southwest Border. Methamphetamine clandestinely produced in Mexico continues to be highly pure and potent as Mexican TCOs have adapted to precursor restrictions on pseudoephedrine by switching to producing the drug using the reductive amination method. This method calls for the use of phenyl- 2-proponone (P2P) instead of pseudoephedrine. According to the DEA MPP, samples analyzed in recent years were almost exclusively produced by a reductive amination method, using P2P as the precursor chemical.
(U) Methamphetamine Conversion Laboratory Seized in Washington State

(U) Photo 4. The final processing of crystal methamphetamine. Source: DEA
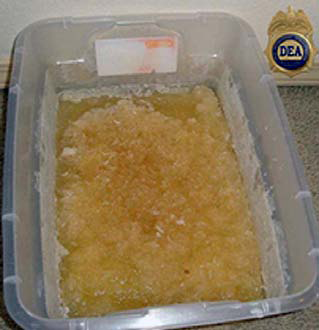
In February 2014,
federal and local law enforcement officers arrested 13 individuals and
uncovered a methamphetamine conversion lab. Officers seized 50 pounds of
crystal methamphetamine and two gallons of methamphetamine in liquid that was
in the process of being converted to crystal methamphetamine. Over the course
of the year-long investigation, law enforcement seized 66 pounds of crystal
methamphetamine, 2.5 pounds of heroin, a total of $310,000, 25 vehicles (some
with hidden compartments for drugs and cash), and seven firearms (three of them
stolen).
Domestic Production methamphetamine
Domestic methamphetamine production has decreased significantly since 2010, most likely due to restrictions on precursor chemicals in the United States and the increased availability of Mexico-produced methamphetamine. In 2014, most of the seized domestic laboratories were “one pot” or “shake and bake” methamphetamine laboratories. Generally, these laboratories produce two ounces or less of methamphetamine per batch. The ingredients, which are common household items (e.g., pseudoephedrine/ephedrine tablets, lithium batteries, camp fuel, starting fluid, cold packs), are mixed in a container such as a plastic soda bottle, providing a portable way of producing small amounts of methamphetamine.
• The number of domestic methamphetamine laboratories decreased 44 percent from 2010 (10,520) to 2014 (5,935). Additionally, in 2014, 84 percent of all methamphetamine laboratories seized in the United States were small laboratories—capable of producing two ounces or less of methamphetamine. (See Chart 23.)
Methamphetamine in Solution
The concealment of methamphetamine in liquids has increased significantly throughout the United States and especially along the Southwest Border. Methamphetamine in solution refers to powdered methamphetamine that is dissolved in solution, such as water or alcohol (methanol, ethanol, isopropanol). Methamphetamine in solution provides TCOs with a unique concealment method and an equally dangerous threat to innocent civilians. When methamphetamine is dissolved in liquids, the odor and color of the parent liquid may serve to disguise the drug. Methamphetamine in solution is concealed in various consumer products including liquor bottles, detergent bottles, and other commercial product containers that appear to be factory sealed. Most frequently, methamphetamine in solution is concealed in non-alcoholic beverage bottles such as soft drinks, sports drinks, juices, and water bottles. In addition to disguising the methamphetamine in solution as an imported consumer product, it is also concealed in areas of a vehicle typically used to hold liquids such as radiator overflows, batteries, windshield washer fluid reservoirs, and fuel tanks.
• California: In January 2014, a teen crossing the US–Mexico border at the San Ysidro POE claimed the two bottles he carried were apple juice. Upon further questioning, the teen volunteered to drink from the bottles and died hours later from acute methamphetamine intoxication.

U) Photo 5. Pill press. Source: DEA
Conversion Laboratories methamphetamine
Conversion laboratories are not production laboratories, but rather laboratories that convert powder methamphetamine or methamphetamine which has been dissolved in a liquid into crystal methamphetamine. Conversion laboratories present a challenge to law enforcement because they can be small in size and do not require a significant amount of equipment or space. The equipment commonly used in these laboratories consists of plastic containers such as a thermos or coolers; the only chemical commonly used is acetone. (See Photos 3 and 4.)
Methamphetamine tablets
Methamphetamine tablets are often produced using a mixture of powder methamphetamine and caffeine. Methamphetamine in tablet form is often found in Asia and while it is uncommon in the United States there have been seizures in California, Kentucky, and Texas. For example, in December 2014, the DEA Houston FD and the Harris County Sheriff’s Office arrested four individuals and seized approximately 20,000 methamphetamine pills along with two industrial pill presses. (See Photos 5 and 6.)
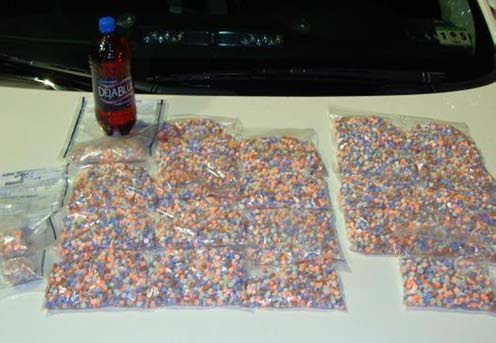
(U) Photo 6. Packs of 1,000 quantity methamphetamine pills Source: DEA
Transportation methamphetamine
Methamphetamine in the United States originates primarily from clandestine laboratories in Mexico and is smuggled across the Southwest Border. Traffickers most commonly transport methamphetamine in tractor trailers and passenger vehicles with hidden compartments. In addition, traffickers send methamphetamine through various mail services or by couriers traveling via bus or commercial airline.
Mexican TCOs are continually looking for new and creative ways to conceal illegal drugs and smuggle them across the border. In addition to seizures of methamphetamine in solution, methamphetamine is concealed as, or co-mingled with, legitimate merchandise.
• Dallas Texas: In August 2014, the DEA Dallas FD seized approximately 275 pounds of crystal methamphetamine, wrapped inside heavy-duty latex balloons and concealed inside hollowed-out coconuts. (See Photo 7.)
(U) Photo 7. Broken coconut with methamphetamine-filled balloon inside. Source: Dallas Field Division HIDTA

• Atlanta, Georgia: In October 2014, the DEA Atlanta HIDTA seized approximately 50 pounds of crystal methamphetamine disguised as, and co–mingled with, candy. (See Photos 8 and 9.)
51
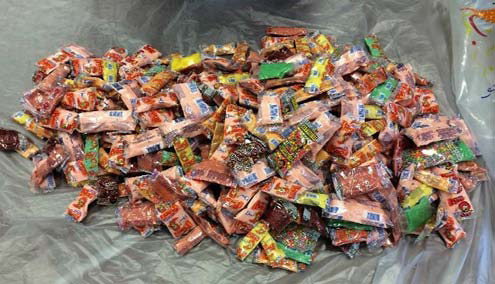
(U) Photo 8. Crystal methamphetamine concealed in candy. Source: DEA Atlanta HIDTA
(U) Photo 9. Crystal methamphetamine concealed in candy. Source: DEA Atlanta HIDTA
Distribution methamphetamine
Mexican TCOs control wholesale methamphetamine distribution, while both Mexican and Caucasian criminal groups typically control retail distribution. However, African American criminal groups have been increasingly involved in the retail distribution of methamphetamine in some areas of the United States.
• New Orleans, Louisiana: Methamphetamine has historically been distributed by Caucasian criminal groups in the New Orleans area. However, law enforcement reporting indicates that African American criminal groups are becoming increasingly involved in the use, transportation, and distribution of methamphetamine.
• Atlanta, Georgia: Methamphetamine has almost exclusively been dominated by Mexican TCOs, while retail distribution has been handled by Caucasian criminal groups. However, there has been an increase of African American criminal groups involvement in the retail distribution of methamphetamine.
St Louis, Missouri: While Mexican TCOs typically transport methamphetamine into the St. Louis area, there have been reports indicating African American groups are now involved in the retail distribution of methamphetamine.
(U) Photo 10. Methamphetamine disguised as candles. Source: Gulf Coast HIDTA
[52]
Outlook [methamphetamine]
Methamphetamine availability will continue to increase as Mexican TCOs have adapted to restrictions placed on precursor chemicals and are able to continue producing large amounts of high-purity, high-potency methamphetamine. Methamphetamine use and treatment admissions will likely increase in the near term, especially if cocaine supplies remain at low levels, inducing distributors and users to switch to methamphetamine. Mexican TCOs will continue to adapt their methods of concealment, and seizures of methamphetamine in solution will likely increase as this method has proven successful in the past. Mexican TCOs will continue to control wholesale distribution and, although Mexican TCOs are involved in retail distribution, other independent criminal groups will likely increase their involvement in the methamphetamine market.
(U) Mexican TCOs Use Drones to Transport Methamphetamine
(U) Photo 11. Unmanned Aerial System (UAS), or “drone” seized near San Ysidro POE Source: DEA
In recent years, law enforcement reporting indicates an increase in the number of UAS, or “drones,” used by TCOs. UASs are small, quiet, can fly at high altitudes over a distance of several miles and, depending on their size, are generally capable of carrying 5 to 10 pounds of drugs. While UASs will not replace traditional methods of moving contraband, the low costs and simplicity of operation present a very attractive, cost efficient addition to current transportation methods.
• San Ysidro, California: In January 2015, a “drone” crashed in a supermarket parking lot in Mexico, near the San Ysidro POE. (See Photo 11.) This drone likely crashed due to the excess weight it carried. The six-propeller remote-controlled aircraft was weighted down with six packages of methamphetamine weighing more than six pounds.
[54]
Disclaimer: The author of each article published on this web site owns his or her own words. The opinions, beliefs and viewpoints expressed by the various authors and forum participants on this site do not necessarily reflect the opinions, beliefs and viewpoints of Utah Standard News or official policies of the USN and may actually reflect positions that USN actively opposes. No claim in public domain or fair use. © Edmunds Tucker. UTopiAH are trade marks of the author. Utopia was written in 1515 by Sir Thomas More, Chancellor of England.
[2015 Drug Threat Assessment continues next at Part 84 Cocaine]
Utah Standard News depends on the support of readers like you.
Good Journalism requires time, expertise, passion and money. We know you appreciate the coverage here. Please help us to continue as an alternative news website by becoming a subscriber or making a donation. To learn more about our subscription options or make a donation, click here.
To Advertise on UtahStandardNews.com, please contact us at: ed@utahstandardnews.com.
Comments - No Responses to “Part 83 United States Drug Enforcement Administration Releases 2015 National Drug Threat Assessment Summary Methamphetamine. Mexico. Smuggling. Deaths Traffic crashes, seizures, or heart attacks. DEA ICE FDA”
Sure is empty down here...