
Part 80 United States Drug Enforcement Administration Releases 2015 National Drug Threat Assessment Summary from Controlled Prescription Drugs (CPDs), (pain relievers, tranquilizers, stimulants, and sedatives, deaths attributable to CPDs has outpaced those for cocaine and heroin combined, abuse is second only to marijuana, reckless prescribing, Medicaid or Medicare fraud, forgery, and registration offense, OxyContin®, oxycodone, economic impact, pill mills. Smuggling Mexico DEA ICE FDA
[2015 Drug Threat Assessment Continued from Part 79]
U.S. Justice Department Drug Enforcement Administration
Controlled Prescription Drugs (CPDs)
The US Drug Enforcement Administration 2015 National Drug Threat Assessment (NDTA) is a comprehensive report of the threat posed to the United States by the trafficking and abuse of illicit drugs, the nonmedical use of CPDs, [Controlled Prescription Drugs] , money laundering, TCOs [Transnational Criminal Organization] , gangs , smuggling, seizures, investigations, arrests, drug purity or potency, and drug prices, in order to provide the most accurate data possible to policymakers, law enforcement authorities, and intelligence officials.
Part 80 United States Drug Enforcement Administration Releases 2015 National Drug Threat Assessment Summary
from Controlled Prescription Drugs (CPDs), (pain relievers, tranquilizers, stimulants, and sedatives, deaths attributable to CPDs has outpaced those for cocaine and heroin combined, abuse is second only to marijuana, reckless prescribing, Medicaid or Medicare fraud, forgery, and registration offense, OxyContin®, oxycodone, economic impact, pill mills.
Overview Controlled Prescription Drugs
The threat posed by CPD abuse is prevalent, and every year since 2002 the number of deaths attributable to CPDs has outpaced those for cocaine and heroin combined. While recent data suggest that abuse of these drugs has lessened in some areas, the number of individuals reporting current use of CPDs is more than those reporting use of cocaine, heroin, methamphetamine, MDMA, and PCP combined. With the slightly declining abuse levels of CPDs, data indicate there is a corresponding increase in heroin use. Many CPD abusers begin using heroin as a cheaper alternative to the high price of illicit CPDs or when they are unable to obtain prescription drugs.
Availability Controlled Prescription Drugs
DEA investigative reporting shows high CPD availability in cities throughout the United States. (See Table 2.) Ten of DEA’s 21 domestic Field Divisionsiii (FDs) list CPDs as one of their top three drug threats. Additionally, 17 of the 21 FDs reported that CPD availability was high during the first half of 2014; four other FDs reported moderate CPD availability. Finally, most FDs reported that availability was stable at high levels compared to the previous reporting period. Significantly, only the Miami FD indicated less availability this reporting period compared to the previous. (See discussion on Florida on pages 20 – 22.)
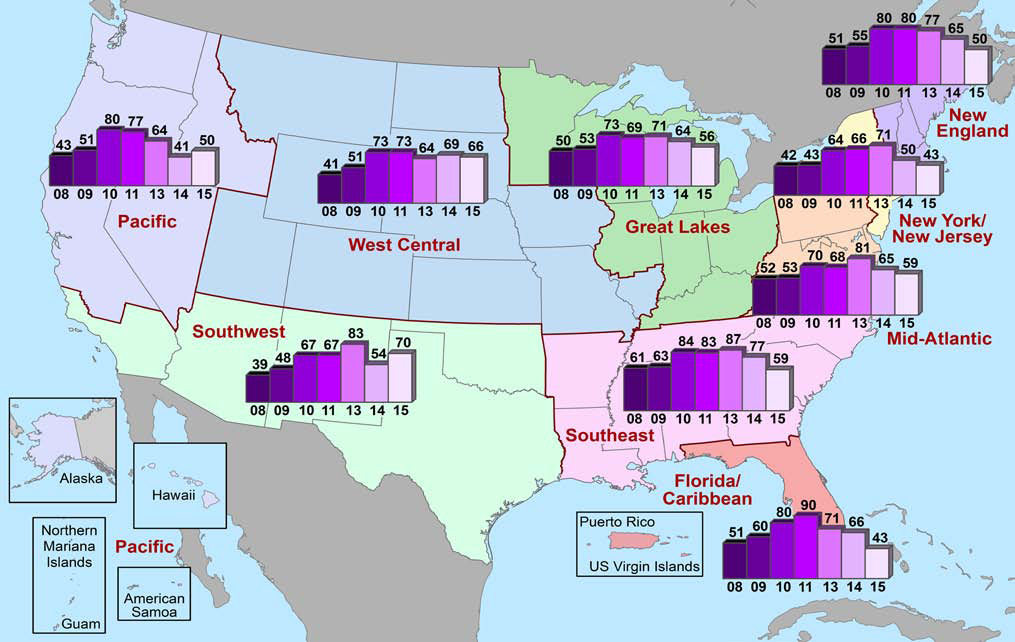
According to the 2015 National Drug Threat Surveyiv (NDTS), 15 percent of respondents nation widev indicated that CPDs were the greatest drug threat in their area—down considerably from 2013 when 28 percent reported the same. (See Chart 3 and Map A3 in Appendix A.) Additionally, the number of respondents reporting high availability of CPDs nationwide declined from 2014 (75.4%) to 2015 (56.7%). (See Map 3.) The OCDETF regionsvi with the largest number of respondents ranking CPDs as the greatest drug threat were New England, New York/New Jersey, and the Southeast. (See Maps A4 and A6 in Appendix A and Table B1 in Appendix B.) The significant decrease in the number of Florida/ Caribbean respondents reporting CPDs as the greatest drug threat is largely due to successful law enforcement initiatives and the implementation of a state-wide Prescription Drug Monitoring Programvii (PDMP) in Florida.
iii See Map A14 in Appendix A.
iv The National Drug Threat Survey, or NDTS, is conducted annually to solicit information from a nationally representative sample of state, local, and tribal law enforcement agencies. The recipients of the survey were queried on their perception of the drug threat in their jurisdiction relative to the availability, demand, transportation, and distribution of heroin, methamphetamine, cocaine, marijuana, CPDs, and synthetic drugs. In 2015, the survey was disseminated to 2,761 recipients. There were 1,105 respondents from across the country. From 2013 to 2015, the NDTS received responses from 40 to 48 percent of those who received the survey. The NDTS was conducted annually from 2000 to 2011 by the National Drug Intelligence Center.
v See Map A2 in Appendix A.
vi See Map A1 in Appendix A.
(U) Table 2: DEA Field Division Reporting of CPD Availability in the First Half of 2014 and Comparison to Previous Period, Source: DEA Controlled Prescription Drugs (CPDs)
Availability During First Half 2014
Availability Compared to Second Half 2013
Field Division
Atlanta Field Division High Stable
Caribbean Field Division Moderate Stable
Chicago Field Division High Stable
Dallas Field Division High Stable
Denver Field Division High Stable
Detroit Field Division High More
El Paso Field Division Moderate Stable
Houston Field Division Moderate Stable
Los Angeles Field Division High Stable
Miami Field Division High Less
New England Field Division High Stable
New Jersey Field Division High Stable
New Orleans Field Division High Stable
New York Field Division High Stable
Philadelphia Field Division High More
Phoenix Field Division High Stable
San Diego Field Division High More
San Francisco Field Division Moderate Stable
Seattle Field Division High Stable
St. Louis Field Division High Stable
Washington Field Division High Stable
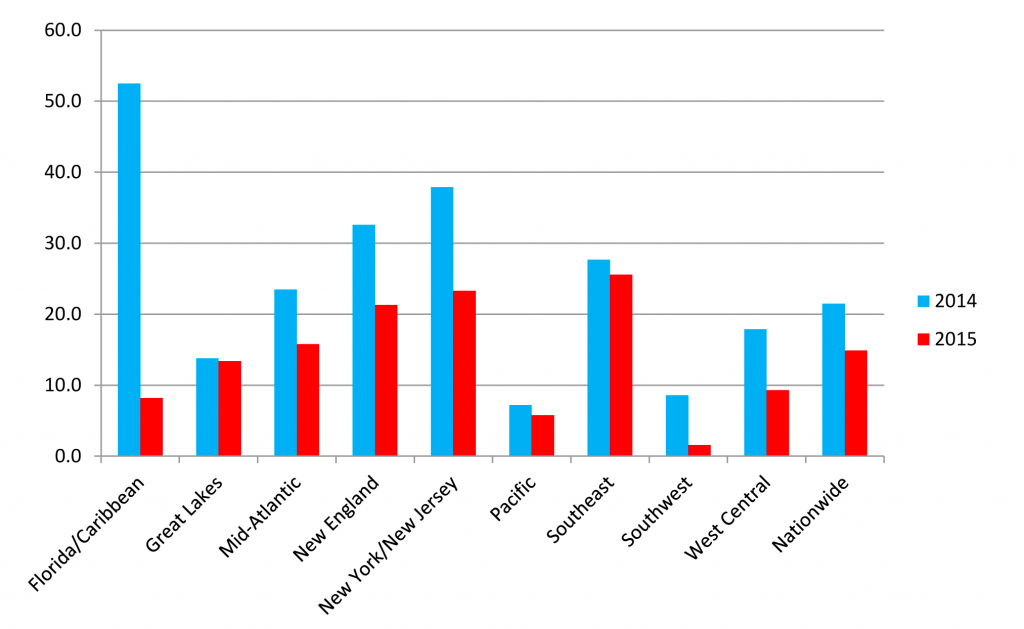
(U) Chart 3. OCDETF Regions Reporting CPDs as Greatest Drug Threat, 2014 – 2015 Source: National Drug Threat Survey Controlled Prescription Drugs (CPDs)
(U) DEA’s Ninth Prescription Drug Take-Back Day Nets 309 Tons of Pills. Four years after creating the National Prescription Drug Take-Back Day Initiative, DEA hosted its ninth one in September 2014, collecting 309 tons of unused or unwanted prescription drugs. This brought the total amount of drugs collected in four years to 2,411 tons.
DEA began hosting the National Prescription Drug Take-Back Day in September 2010 because at that time the Controlled Substances Act (CSA) made no legal provision for patients and their caregivers to dispose of unwanted CPDs except to give them to law enforcement (it was illegal for hospitals or pharmacies to accept unused or unwanted drugs). On September 9, 2014, DEA published new disposal regulations in the Federal Register allowing certain authorized DEA registrants (manufacturers, distributors, reverse distributors, narcotic treatment programs, retail pharmacies, and hospital/clinics with an on-site pharmacy) to become authorized collectors.
A Prescription Drug Monitoring Program, or PDMP, is a statewide electronic database, which collects designated data on substances dispensed in the state. The PDMP is housed by a specified statewide regulatory, administrative, or law enforcement agency. The housing agency distributes data from the database to individuals who are authorized under state law to receive the information for purposes of their profession.
Abuse Controlled Prescription Drugs
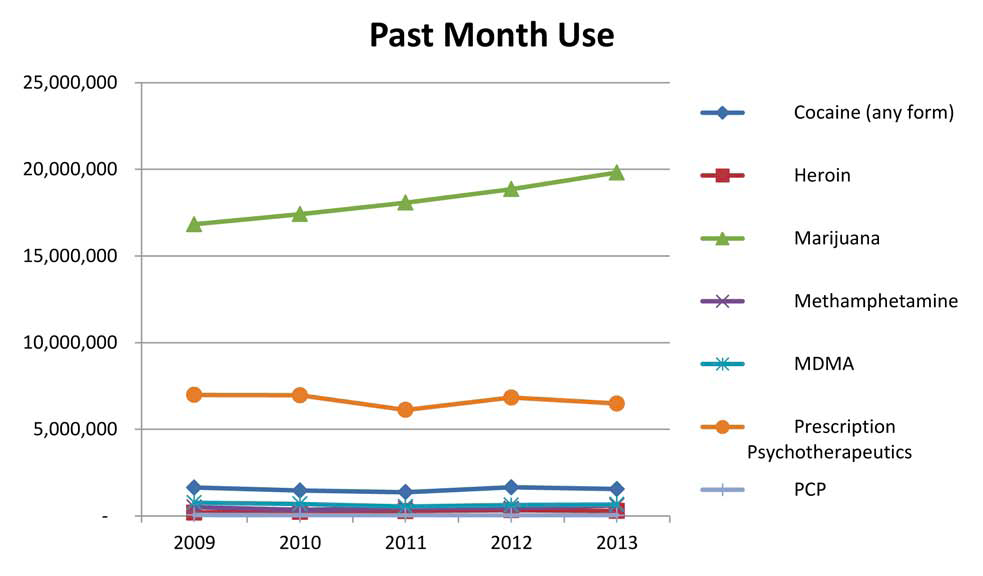
Survey, treatment, and demand data indicate high levels of CPD abuse. The number of individuals reporting current CPD abuse is second only to marijuana and is more than those reporting abuse of cocaine, heroin, methamphetamine, MDMA, and PCP combined. (See Chart 4.) The number of treatment admissions to publicly funded facilities for non-heroin opiate/synthetic abuse in 2012 was 36.5 percent higher than the number in 2008; however the number of admissions declined from 2011 to 2012. This decline can likely be attributed to the number of CPD abusers using heroin, which increased from 2011 to 2012. Many abusers, when unable to obtain or afford CPDs, begin using heroin, a cheaper alternative that offers similar physiological effects.
• The National Survey of Drug Use and Health (NSDUH) data indicate slight declines in the number of past month, past year, and lifetime nonmedical users of psychotherapeutic drugs. In 2012, there were 6.83 million people aged 12 or older who reported current (past month) non-medical use of psychotherapeutic drugs. In 2013, that number declined to 6.48 million. (See Chart 4 and Table B2 in Appendix B.)
• According to Treatment Episode Data Set (TEDS) information, non-heroin-related opiate treatment admissions to publicly funded treatment facilities increased every year from 2002 to 2011, before posting its first decline in 2012, the latest year for which national-level data is available. In 2011, there were 194,583 non-heroin-related opiate admissions, but that number decreased 13 percent to 169,868 in 2012. (See Table B3 in Appendix B.)
• Monitoring the Future (MTF) survey data for 2014 show a decrease in adolescent trends for past year CPD use. MTF queried 12th grade students on CPD abuse and only 13.9 percent of those surveyed indicated past year use of CPDs, down from 15.0 percent in 2013. (See Table B4 in Appendix B.)
• In 2011, the Centers for Disease Control (CDC) reported that drug misuse and abuse caused approximately 2.5 million emergency department visits. Of these, more than 1.4 million were CPD-related.
The National Drug Threat Survey was not administered in 2012.
(U) Map 3. Percentage of NDTS Respondents Reporting High CPD Availability in their Jurisdictions 2008 – 2011, 2013 – 2015 viii
(U) Chart 4. Number of Past Month, Nonmedical Users of Psychotherapeutic Drugs Compared to Other Select Drugs of Abuse, 2009 – 2013 Controlled Prescription Drugs (CPDs)
(U) Hydrocodone Combination Products moved from Schedule III to Schedule II Controlled Prescription Drugs (CPDs)
On August 22, 2014, DEA published in the Federal Register the Final Rule moving hydrocodone combination products (HCPsix) from Schedule III to the more-restrictive Schedule II.
When Congress passed the CSA in 1970, it placed HCPs in Schedule III even though it had placed hydrocodone in Schedule II. The current analysis of HCPs by Health and Human Services (HHS) and the DEA shows HCPs have a high potential for abuse which may lead to severe psychological or physical dependence. Adding nonnarcotic substances like acetaminophen to hydrocodone does not diminish its abuse potential. Data and surveys from multiple federal and non-federal agencies show the extent of abuse of HCPs. For example, MTF surveys of noncollege and college-aged individuals found that twice as many people used the HCP Vicodin®, nonmedically as used OxyContin®, a Schedule II substance, which is more tightly controlled. Vicodin® was abused by 9.5 percent of the noncollege group and 4.4 percent of college students; the corresponding numbers for OxyContin® were 4.4 percent and 2.3 percent.
The purpose of this ruling is to minimize the misuse of HCPs for recreational purposes while still ensuring that patients with severe pain have reasonable access to the amount of HCPs needed to control their pain and suffering.
Hydrocodone combination products (HCPs) are pharmaceuticals containing specified doses of hydrocodone in combination with other drugs, such as acetaminophen, in specified amounts. These products are approved for marketing for the treatment of pain and for cough suppression.
(U) Table 3. Drug Poisoning Deaths Involving Selected Illicit Drugs, 2007 – 2013 Controlled Prescription Drugs (CPDs)
2007 2008 2009 2010 2011 2012 2013
Opioid analgesic 14,408 14,800 15,597 16,651 16,917 16,007 16,235
Cocaine 6,512 5,129 4,350 4,183 4,681 4,404 4,944
Heroin 2,402 3,041 3,278 3,036 4,397 5,927 8,257
Source: National Center for Health Statistics/Centers for Disease Control, Final death data for each calendar year.
Drug overdose deaths have become the leading cause of injury death in the United States. Each day in the United States, over 120 people die as a result of a drug overdose. The number of drug poisoning deaths in 2013, the latest year for which data is available, involving opioid analgesics is substantial and outpaces the number of deaths for cocaine and heroin combined. (See Table 3.)
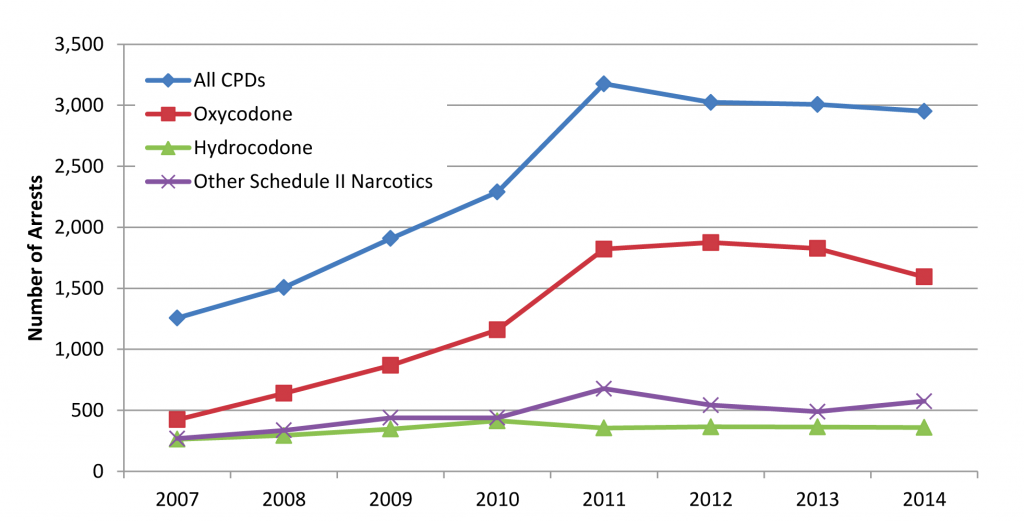
DEA arrest data show that nearly 3,000 individuals were arrested for CPD-related offenses in Fiscal Year (FY) 2014, with just over half of them for opioid-related offenses. However, the number of CPD-related arrests has declined since FY2011. (See Chart 5.)
• Indianapolis, Indiana: On January 6, 2015, DEA and local law enforcement officers arrested a physician and a nurse practitioner on felony charges including reckless prescribing, Medicaid fraud, forgery, and registration offenses. Since 2002, this physician—who had been practicing for 20 years—had operated the largest pain clinic conglomerate in Indiana, with 13 clinics. Since 2013, the excessive prescribing from this health conglomerate was connected to 10 overdose deaths. Four nurse practitioners from the clinics were responsible for writing nearly 127,000 prescriptions over a two-year period.
(U) Chart 5. DEACPD-related Domestic Arrests, Fiscal Years 2007 – 2014.
(U) Chart 6. Source Where Pain Relievers Were Obtained for Most Recent Nonmedical Use among Past Year Users Aged 12 or Older: 2012 – 2013
Source Where User Obtained More than One Doctor 2.6%
Source Where Friend/Relative Obtained Source Where User Obtained
More than One Doctor 2.6%
Free from Friend or Relative 53.0% One Doctor 21.2%
Other1 4.3%
Free from Fr Bought on the Internet 0.1% iend o
r Relative 53.0%
One Doctor 83.8% Source Where Friend/Relative Obtained
One Doctor 83.8%
Drug Dealer/Stranger 4.3%
Bought/Took from Friend or Relative 14.6%
More than One Doctor 3.3%
Free from Friend or Relative 5.1%
Bought/Took from Friend or Relative 4.9%
Drug Dealer/Stranger 1.4%
Bought on the Internet 0.3%
Other1 1.2%
Source: NSDUH Source: DEA
Diversion Controlled Prescription Drugs
According to the 2015 NDTS, nationwide, about half of respondents indicated that diversion of narcotics was high, similar to the percentage the previous year. (See Table B5 in Appendix B.) Additionally, another quarter indicated that narcotic diversion was moderate. Prescription opioid analgesics— specifically those containing oxycodone and hydrocodone—are the most common type of CPDs diverted and abused
(U) Chart 7. How Different Misusers of Pain Relievers Obtain Their Drugs (Percentage) Controlled Prescription Drugs (CPDs)
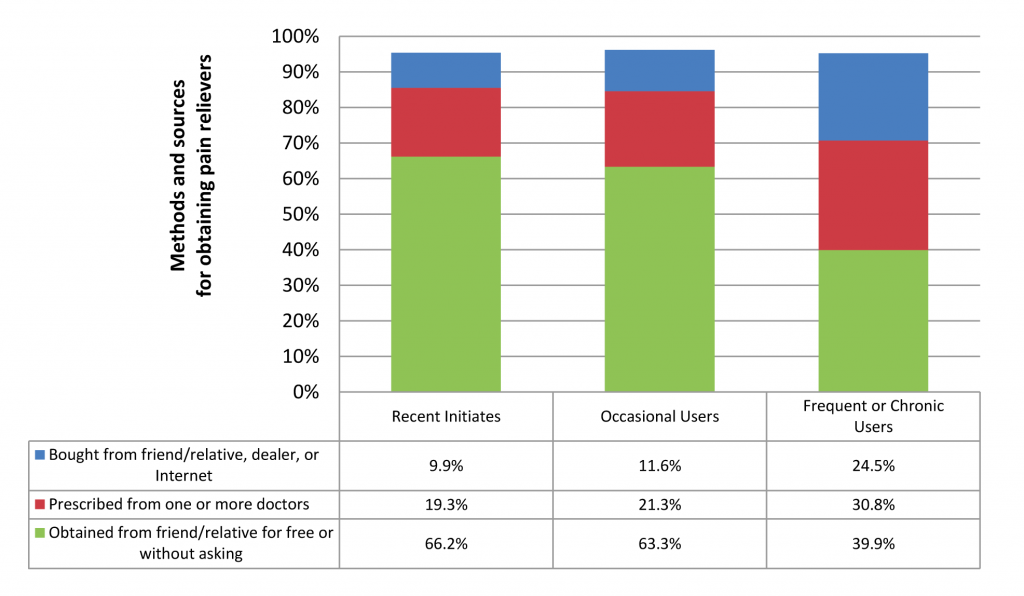
Source: NSDUH
NSDUH data indicate that 53 percent of nonmedical users of CPDs (pain relievers, tranquilizers, stimulants, and sedatives) aged 12 or older got the prescription drugs they most recently used “from a friend or relative for free.” More than four in five of these nonmedical users who obtained prescription drugs from a friend or relative for free indicated that their friend or relative had obtained the drugs from a single doctor. (See Chart 6.) Further analysis of the NSDUH data showed that as CPD users become more frequent abusers, they more frequently obtained CPDs via purchases from friends and family, street dealers, or via the Internet. (See Chart 7.)
In addition to obtaining CPDs from friends and family, CPDs are also frequently diverted from the legitimate market or supply chain for illegal distribution and abuse. Types of diversion include doctor shopping, prescription fraud/forgery, employee theft (from pharmacies, hospitals, physician offices, etc.), non-therapeutic prescribing by rogue practitioners, and burglaries or armed robberies of pharmacies and drug distributors.
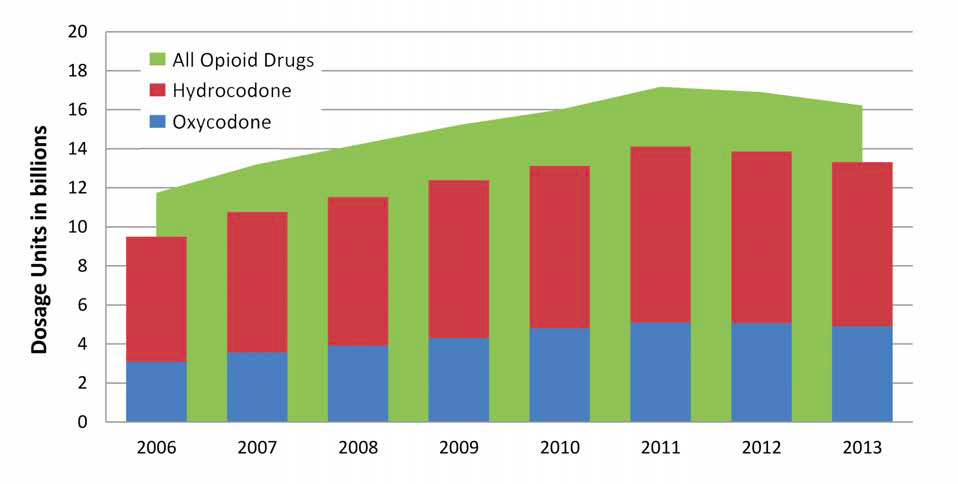
The amount of opioid CPDs available on the legitimate market is significant and a large percentage (over 80%) are oxycodone and hydrocodone products. (See Chart 8.) Data regarding legitimate commercial disbursal of prescription opioids show the amount of opioid CPDs disbursed to pharmacies, hospitals, practitioners, and teaching institutions steadily rose from 2006 to its peak in 2011, before declining slightly to current levels. (See Table 4.)
(U) Chart 8. All Opioid CPDs Compared to the Number of Hydrocodone and Oxycodone CPDs Available on the Legitimate Market, 2006 – 2013
Source: DEA
(U Table 4. Number of Dosage Units of Opioid Narcotics Disbursed to US Distributors by Manufacturers, 2006 – 2014*
2006 2007 2008 2009 2010 2011 2012 2013 2014
Opioids 11.7 13.2 14.2 15.2 16.0 17.2 16.9 16.2 12.0 *January to September 2014. Source: DEA
(U) Table 5. Number of Dosage Units of Opioid Narcotics Lost, 2009 – 2014- Controlled Prescription Drugs (CPDs)
Total Number 2009 2010 2011 2012 2013 2014
746 771 711 802 736 808
While the percentage of opioid narcotics that are diverted from the legitimate market is small—less than 1 percent of what is legitimately available— that amount still totaled more than 10 million dosage units in 2014. (See Table 5.)
CPD diversion by robbery and theft is increasing in some areas of the United States. According to the DEA Drug Theft and Loss Database, the total number of armed robberiesx of DEA registrants where prescription drugs were stolen has fluctuated but increased overall since 2009 (See Table 6). In 2014, California, Nevada, New Mexico, and Oklahoma reported a significant increase in the number of armed robberies from the previous year. (See Map A7 in Appendix A.)
• Baltimore, Maryland: In December 2014, seven individuals hijacked a pharmaceutical delivery truck in Baltimore at gunpoint. The truck and driver were taken to another location in Baltimore where approximately 87 cases of Schedule II and Schedule III narcotics were removed from the delivery truck and transported to a waiting truck. The pharmaceutical truck driver was left abandoned at the second location.
• Des Moines, Iowa: In October 2014, a woman was arrested for robbing a local pharmacy. She told an employee that a man was outside with her children, threatening to harm them unless she returned with Dilaudid®, a Schedule II opioid analgesic. The pharmacist gave her 6 bottles containing a total of 542 pills.
x The DEA Drug, Theft, and Loss Database compiles information as reported by DEA registrants on armed robberies, customer theft, employee pilferage, CPDs lost in transit, and night break-ins at analytical labs, distributors, exporters, hospitals/clinics, importers, manufacturers, mid-level practitioners, pharmacies, practitioners, researchers, reverse distributors, and teaching institutions. Data are self-reported by registrants.
Florida: Legislative and Law Enforcement Measures Curb Diversion
Rogue pain management clinics, commonly referred to as “pill mills,” have contributed greatly to the extensive availability of illicit CPDs in the United States. Florida, long embattled by illegal pill mills and unscrupulous physicians, has recently seen a significant decline in the CPD threat. Successful law enforcement initiatives and the implementation of a state-wide PDMP in September 2011 have contributed to reductions in the number of treatment admissions, doctor shopping episodes, and overdose deaths.
• According to the 2015 NDTS, only 8.2 percent of respondents in the Florida/Caribbean OCDETF region reported CPDs as the greatest drug threat. This is a significant decline from 2013 when over 60 percent reported CPDs as the greatest drug threat and from 2014 when over 52 percent reported the same. (See Table 7.)
(U) Table 5. Number of Dosage Units of Opioid Narcotics Lost, 2009 – 2014
IN MILLIONS
2009 2010 2011 2012 2013 2014
Opioids 12.1 12.5 19.5 13.1 11.5 10.7
Source: DEA
(U) Table 6. Total Number of Prescription Drug Armed Robberies, 2009 – 2014 Controlled Prescription Drugs (CPDs)
2009 2010 2011 2012 2013 2014
Total Number 746 771 711 802 736 808 Source: DEA 21
2015 National Drug Threat Assessment Summary
UNCLASSIFIED
the number of treatment admissions have declined 41 percent from 2011 to 2012. (See Chart 9).
• According to E-FORCSE®, there has been a 53 percent drop in doctor shopping episodes since the implementation of the PDMP.
• In 2009, CPD overdoses in Florida were attributed to one in eight deaths. However, since the implementation of the PDMP, the number of oxycodone deaths declined over 27 percent from 2012 to 2013.
The reformulationxi of OxyContin® in 2010, has also contributed to the decline in CPD abuse indicators. At the height of the CPD abuse problem, OxyContin® was, by far, the most commonly abused CPD in Florida and in the United States. By 2010, drug manufacturers and distributors were disseminating over 650.8 million dosage units of oxycodone products to Florida dispensaries.
UNCLASSIFIED
Controlled Prescription Drugs (CPDs)
(U) Chart 9. Non-heroin Opioid/Synthetics Treatment Admissions, Florida Number of Admissions Aged 12 and Older, 2002 – 2012
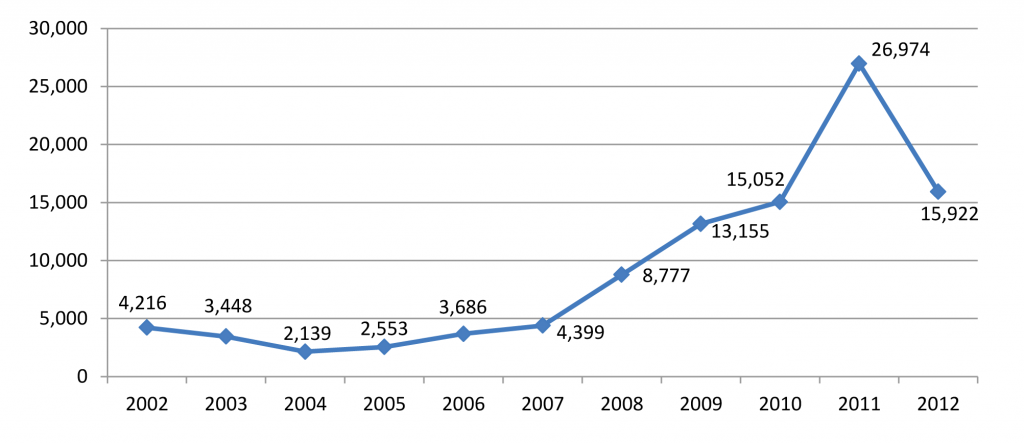
Source: Treatment Episode Data Set
(U) Table 7. 2015 NDTS Florida/ Caribbean Respondents Reporting CPDs as Greatest Drug Threat Controlled Prescription Drugs (CPDs
PERCENTAGE
OCDETF Region 2013 2014 2015
Florida/Caribbean 60.4 52.5 8.2
Source: National Drug Threat Survey
• The number of non-heroin opiate treatment admissions in Florida increased 540 percent from 2002 to 2011. However, since the Florida PDMP, E-FORCSE®, was funded in 2011, the number of treatment admissions have declined 41 percent from 2011 to 2012. (See Chart 9).
• According to E-FORCSE®, there has been a 53 percent drop in doctor shopping episodes since the implementation of the PDMP.
• In 2009, CPD overdoses in Florida were attributed to one in eight deaths. However, since the implementation of the PDMP, the number of oxycodone deaths declined over 27 percent from 2012 to 2013.
The reformulationxi of OxyContin® in 2010, has also contributed to the decline in CPD abuse indicators. At the height of the CPD abuse problem, OxyContin® was, by far, the most commonly abused CPD in Florida and in the United States. By 2010, drug manufacturers and distributors were disseminating over 650.8 million dosage units of oxycodone products to Florida dispensaries.
OxyContin® was reformulated to include a tamper-resistant ingredient that made it more difficult to abuse and made it less potent to those who did abuse the drug. The reformulated version can still be abused if crushed and taken orally, but does not provide as potent a high, because the pieces still retain some of their time-release ingredient, which delays absorption.
(U) Florida Pill Mill Arrests Controlled Prescription Drugs (CPDs
In January 2015, a Tampa physician and his wife were arrested for conspiracy to possess with intent to distribute oxycodone and conspiracy to commit money laundering. The physician is also facing substantive counts charging him with multiple drug toxicity deaths of three individuals dating back to 2011. The physician operated out of his Pinellas Park pain clinic and wrote prescriptions for various drugs, charging $300 cash or credit per patient visit. The physician’s wife handled all monies generated by the pain clinic transferring large sums into and out of local Tampa area banks, as well as money transfers to Canada. This three-year investigation resulted in the seizure of $2.6 million in assets, including currency, gold coins, jewelry, vehicles, and real property.
(U) Florida CPD Facts 2009 – 2011
• In 2009, one in eight deaths in Florida was attributable to CPD overdose.
• By 2010, 90 of the top 100 physicians purchasing oxycodone in the United States were located in Florida.
• There were more than 2,500 overdose deaths in 2010 and again in 2011.
• In 2011, a statewide public health emergency was declared on the prescription drug problem.
2015 National Drug Threat Assessment Summary
UNCLASSIFIED
Controlled Prescription Drugs (CPDs)
However, by 2013, that number had declined more than 51 percent to only 317.8 million dosage units. (See Chart 10.)
During the height of the Florida pill mill problem, traffickers from numerous other states traveled to Florida to obtain multi-hundred dosage units of prescription narcotics. However, since the implementation of Florida’s PDMP, many of the pill mill physicians began relocating from Florida to other states, such as Georgia and Massachusetts. As a result, traffickers and abusers are now traveling to neighboring states such as Alabama, Georgia, and Tennessee to obtain CPDs. Incidentally, although Georgia’s PDMP became operational in January 2013, the state was unable to secure grant funding to keep the PDMP operating past September 2015.
• Orlando, Florida: In September 2014, two individuals were sentenced for their role in a multi-state prescription organization. The head of this organization arranged for fellow members to travel to Florida from Puerto Rico and Massachusetts to obtain CPDs, primarily oxycodone. Once the CPDs were obtained from Florida pharmacies, the drugs were mailed back to Massachusetts for distribution.
• Savannah, Georgia: In August 2014, a Georgia physician was sentenced to over 11 years in prison for his part in writing excessive prescriptions for oxycodone. The physician worked for a Georgia pain management clinic for 25 days in 2011 during which he wrote prescriptions for 196 patients. The patients had traveled to Georgia from Kentucky, Ohio, and Florida. Eight other individuals, who either organized or worked for the clinic, some of whom had no medical education or training, were also charged. The clinic organizers had been associated with pill mill operations in Florida, but relocated to Georgia after changes in Florida law restricted non-medical doctors from owning pain clinics.
• Atlanta, Georgia: In June 2014, two area physicians were each sentenced to 15 years in prison on federal drug and money laundering charges. The two individuals owned and operated a pain clinic, which served as a front for the mass distribution of pain killers, primarily oxycodone. One of the physicians sentenced had relocated his pill mill operation to Georgia after being acquitted for similar charges of running a Florida pill mill.
Economic Impact of Prescription Drug Abuse – UNCLASSIFIED
Controlled Prescription Drugs (CPDs
The economic impact of prescription drug abuse is significant. Healthcare costs were expected to surpass $3 trillion by 2014. The most conservative estimate of the amount of total healthcare expenditures lost to fraud is three percent; however, that equates to over $70 billion annually. Losses attributed to wasteful spending, including fraud and abuse, may actually be as high as 30 percent of healthcare expenditures.
Unscrupulous physicians add to the health care burden in the United States. In pill mills across the country, most physicians accept cash payments from patients and some often file claims with private insurance companies and Medicare/ Medicaid. Corrupt pharmacists also contribute to burgeoning health care costs in the United States.
• Miami, Florida: In June 2014, a Miami Beach physician was sentenced for his role in a Medicare fraud scheme. The physician admitted to executing a scheme to defraud the Medicare program and attempting to cause a loss in excess of $2.5 million dollars. He was ordered to forfeit $1.6 million dollars and his Miami residence, as well as pay nearly $1.65 million in restitution to the Centers for Medicare and Medicaid Services, the amount of loss suffered by the Medicare program.
• Boston, Massachusetts: In March 2014, a physician specializing in pain management was charged with overbilling the Medicare program. This doctor overbooked patient appointments, often with as many as four patients per slot, and trained physician assistants and registered nurses to overbill the Medicare program. This physician owned pain management clinics in Massachusetts and Rhode Island and reportedly billed Medicare nearly $3.5 million in 2012.
Outlook Controlled Prescription Drugs
CPD availability and abuse will continue to pose a significant drug threat to the United States. The implementation of legislation and successful law enforcement efforts have proven effective in various areas of the country. However, as these measures succeed in one area, abusers and traffickers move their operations to parts of the country in which PDMPs do not exist or are not fully funded, thereby increasing the CPD threat in a new area.
(U) Twin Brother Pharmacists Sentenced to Prison for Health Care Fraud
In March 2014, two Newark, New Jersey pharmacists—twin brothers—were each sentenced to 42 months in prison for reaping at least $15 million by defrauding patients, Medicaid, and private insurance companies over the previous 15 years. These pharmacists devised a multifaceted system in which they:
• Under-filled prescriptions, yet billed Medicaid and private insurers for a fully-filled prescription.
• Substituted generic drugs, unbeknownst to the patient, and billed Medicaid and private insurance companies for the full cost of the brand-name drug.
• Filled outstanding refills without a patients’ knowledge or consent, and filed insurance claims.
• Purchased prescription drugs back from existing patients and reused those drugs to fill other patients’ prescriptions, before billing Medicaid or private insurance companies.
• Purchased heavily discounted prescription drugs from non-licensed wholesalers and billed Medicaid and private insurers for the full costs of the drug.
Disclaimer: The author of each article published on this web site owns his or her own words. The opinions, beliefs and viewpoints expressed by the various authors and forum participants on this site do not necessarily reflect the opinions, beliefs and viewpoints of Utah Standard News or official policies of the USN and may actually reflect positions that USN actively opposes. No claim in public domain or fair use. © Edmunds Tucker. UTopiAH are trade marks of the author. Utopia was written in 1515 by Sir Thomas More, Chancellor of England.
[2015 Drug Threat Assessment continues next at Part 81]
Utah Standard News depends on the support of readers like you.
Good Journalism requires time, expertise, passion and money. We know you appreciate the coverage here. Please help us to continue as an alternative news website by becoming a subscriber or making a donation. To learn more about our subscription options or make a donation, click here.
To Advertise on UtahStandardNews.com, please contact us at: ed@utahstandardnews.com.
Comments - No Responses to “Part 80 United States Drug Enforcement Administration Releases 2015 National Drug Threat Assessment Summary from Controlled Prescription Drugs (CPDs), (pain relievers, tranquilizers, stimulants, and sedatives, deaths attributable to CPDs has outpaced those for cocaine and heroin combined, abuse is second only to marijuana, reckless prescribing, Medicaid or Medicare fraud, forgery, and registration offense, OxyContin®, oxycodone, economic impact, pill mills. Smuggling Mexico DEA ICE FDA”
Sure is empty down here...