
Part two, 1960 census life expectancy rankings by state, divided by Red and Blue.
UTopiAH. This is Part of a series for comparing census based life expectancy and death rate tables, ranking states by how long we live, from 1960 to 2015. Included are medical conditions rating Utah’s #1 health rankings. Since 2012 state rankings are now correlated to voting in the 2012 and 2016 presidential elections, with blue states on top, and red states at the bottom. Utopia is Sir Thomas More’s (1516) perfect place to live, and with a slight variation in spelling, perfectly describes Utah.
Pt 2 – 3 Nephi 14 verse 18 and 20 A good tree cannot bring forth evil fruit, neither a corrupt tree bring forth good fruit.
Wherefore, by their fruits ye shall know them.
Part two, this is the 1960 census life expectancy rankings by state, divided by Red and Blue.
For fifty years, life expectancy, was based on the census taken every ten years. States were rank ordered based on the longevity of their residents’ lives. Longevity has been the basis for 1)commercial uses, 2)health programs, 3)governmental budgets, and4) forward planning. 1)Commercial uses include a) annuity tables for retirement investments – how long the annuity will be needed to provide a life time income? and hence its cost; b) life insurance tables for payment of death benefits and when death benefits will be due, and hence the premium for the insurance; c) population growth, long term care. 2) Health programs use include age related maladies and hospitalization. 3) Governmental budgets include Medicare, Medicaid, Affordable Care Act so called Obamacare, development, public health, education, transportation, and national security. 4) Forward planning includes water resources, urban planning, social services, and family growth,. Progress or decline in life expectancy, takes decades. For instance noting that Utah’s life expectancy ranked 6th in 1960, Utah climbed to 2nd in 1970, back to 3rd in 1980, and topped out to 1st by 1990. It is even harder to move among ranks the larger the population in the State. California’s population is ten times Utah’s. California’s life expectancy ranked 19th in 1960 census, climbed to 14th in 1970, 18th in 1980, and dropped back to 32nd in 1990 (calculated in 2004). Sifting through hundreds of millions of records took 14 years from 1990 to 2004.
https://www.census.gov/population/www/documentation/twps0049/tab03.pdf
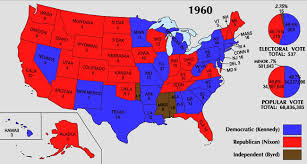 1960 Blue Democratic Kennedy Red Republican Nixon
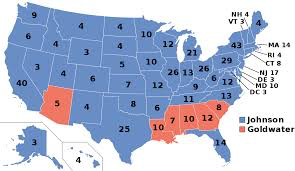 1964 Election Blue Democrat Johnson, Red Republican Goldwater
Table 3. Rankings of State Life Expectancy at Birth for White Males: 1960 to 1990
State* Year 1960
1960 Presidential election, Red State versus Blue State
| State Republican | 1960 census life expectancy rank | Democratic |
| North Dakota Nebraska Kansas * Iowa | 1 2 3 4 5 | * * * Minnesota |
| Utah Wisconsin * South Dakota Idaho | 6 7 8 9
10 | * * Connecticut *
* |
| * Oklahoma * Florida Washington | 11 12 13 14 15 | Arkansas * Missouri * * |
| * * Ohio California Colorado | 16 17 18 19 20 | Rhode Island Texas * * * |
| * * Indiana Oregon | 21 22 23 24 25 | Michigan Delaware * New Jersey * |
| * Tennessee * * | 26 27 28 29 30 | Massachusetts * New York Illinois (I) Mississippi |
| Virginia Kentucky * New Hampshire * | 31 32 33 34 35 | * * Alabama * Pennsylvania |
| Vermont * * Maine * | 36 37 38 39 40 | * Maryland North Carolina *New Mexico |
| * Wyoming * * Montana | 41 42 43 44 45 | Georgia * Louisiana West Virginia * |
| Arizona * * | 46 47 48 49 | * So. Carolina D.C. Nevada |
Footnotes:
*Alaska and Hawaii are excluded from the rankings since life expectancy was not calculated in 1970 for these two states. Sources: National Center for Health Statistics, 1975. Some Trends and Comparisons of United States Life-
Table Data: 1900-1971. National Center for Health Statistics, 1985-86. State Life Tables, Alabama-Wyoming, U.S. Decennial Life Tables for 1979-81. National Center for Health Statistics, 1998. U.S. Decennial Life Tables for 1989-91, State Life Tables.
Source: U.S. Census Bureau
Internet Release date: September 26, 2003
43
Disclaimer: The author of each article published on this web site owns his or her own words. The opinions, beliefs and viewpoints expressed by the various authors and forum participants on this site do not necessarily reflect the opinions, beliefs and viewpoints of Utah Standard News or official policies of the USN and may actually reflect positions that USN actively opposes. No claim in public domain or fair use. © Edmunds Tucker
Utah Standard News depends on the support of readers like you.
Good Journalism requires time, expertise, passion and money. We know you appreciate the coverage here. Please help us to continue as an alternative news website by becoming a subscriber or making a donation. To learn more about our subscription options or make a donation, click here.
To Advertise on UtahStandardNews.com, please contact us at: ed@utahstandardnews.com.
Comments - No Responses to “Part two, 1960 census life expectancy rankings by state, divided by Red and Blue.”
Sure is empty down here...