
Part 85 United States Drug Enforcement Administration Releases 2015 National Drug Threat Assessment Summary of Marijuana, death of 3 children, 41 adults killed, smuggling Mexico, Canada, the Caribbean, Butane Honey Oil, BHO, Hash Oil, Dabs / Dabbing, Wax, Shatter, 710, and Errl. Marijuana remains an illegal substance. DEA ICE FDA
[2015 Drug Threat Assessment Continued from Part 84 Cocaine]

2015 National Drug Threat Assessment Marijuana
The US Drug Enforcement Administration 2015 National Drug Threat Assessment (NDTA) is a comprehensive report of the threat posed to the United States by the trafficking and abuse of illicit drugs, the nonmedical use of CPDs, [Controlled Prescription Drugs] , money laundering, TCOs [Transnational Criminal Organization] , gangs , smuggling, seizures, investigations, arrests, drug purity or potency, and drug prices, in order to provide the most accurate data possible to policymakers, law enforcement authorities, and intelligence officials.
Part 85 United States Drug Enforcement Administration Releases 2015 National Drug Threat Assessment Summary of Marijuana, death of 3 children., 41 adults were killed, smuggled from Mexico, Canada and the Caribbean, Butane Honey Oil, BHO, Hash Oil, Dabs/Dabbing, Wax, Shatter, 710, and Errl. Marijuana remains an illegal substance.
Overview Marijuana
Marijuana is the most widely available and commonly used illicit drug in the United States. Marijuana remains illegal under federal law, however, many states have passed legislation approving the cultivation, possession, and use of marijuana within their respective states. The disparity between federal law and state laws authorizing the use of “medical” or “retail” marijuana has hindered federal, state, local, and tribal law enforcement efforts given the different regulatory regimes at the state level. Likewise, the increased production and use of marijuana in those states with medical or retail marijuana laws is adversely affecting states in which marijuana remains an illegal substance.
While it is too early to determine the full impact of state marijuana legalization–both recreational and medical–legalization [sic the FDA advises there is no medical use] measures have had several effects, including increases in domestically-produced marijuana, a shift in demand for higher-quality marijuana, increasing seizures of marijuana concentrates, and an increasing number of tetrahydrocannabinol (THC) extraction laboratories.
Availability Marijuana
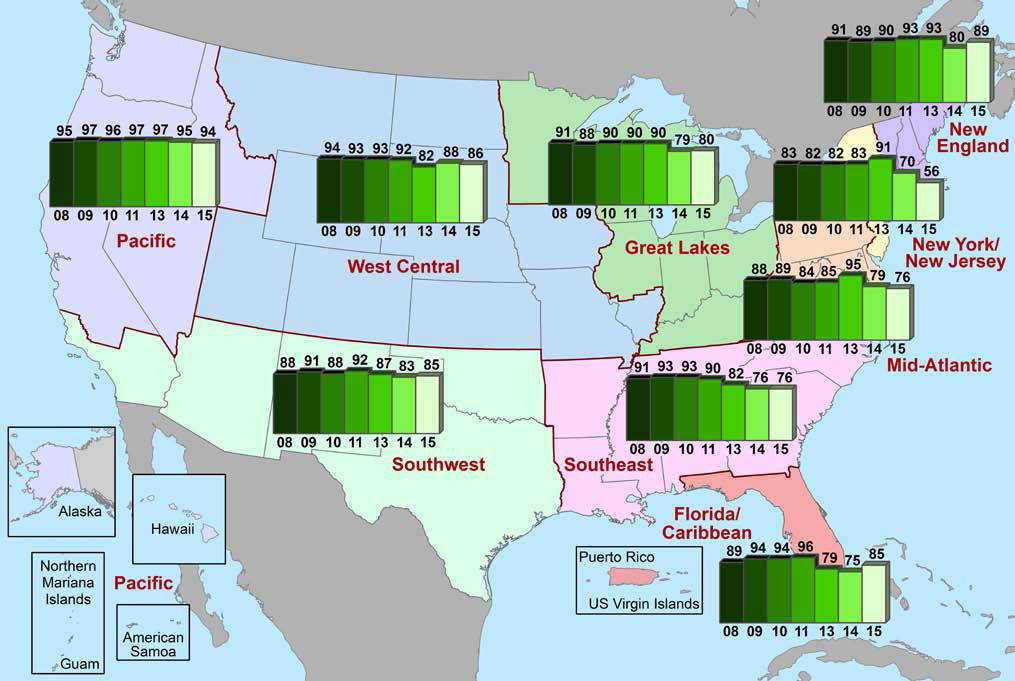
Marijuana is available in all areas of the United States. According to the 2015 NDTS, 80 percent of responding agencies reported that marijuana availability was high in their jurisdictions, and 16 percent reported that marijuana availability was moderate. (See Map 12.) In addition, 57 percent of respondents reported that marijuana availability had stayed the same, while 37 percent reported that availability had increased over the past year.
(U) Map 12. Percentage of NDTS Respondents Reporting High Marijuana Availability, 2008 – 2011, 2013 – 2015 Source: National Drug Threat Survey
• According to the MTF survey data, 81 percent of high-school seniors say it is easy to obtain marijuana.
All but five DEA FDs reported that marijuana availability was high in their jurisdictions, and that availability remained stable from 2013 to 2014.
• The DEA New England and Dallas FDs reported marijuana availability was high in their jurisdiction, with an increase in availability from 2013 to 2014.
• The DEA New Jersey, New York, and Washington FDs reported marijuana availability was moderate and remained stable from 2013 to 2014.
Beginning in 2013, the number of DEA domestic marijuana-related investigations surpassed the number of investigations involving foreign- [66] produced marijuana. (See Chart 27.)
(U) Chart 27. DEA Domestic Marijuana Cases FY2007 to FY2014 Source: DEA
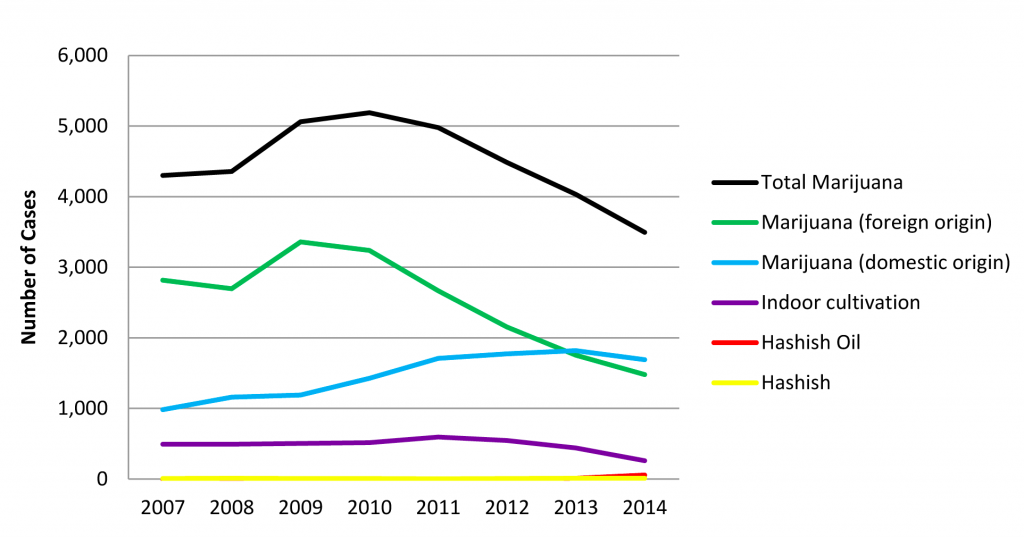
Total Marijuana
Marijuana (foreign origin)
Marijuana (domestic origin)
Hashish Oil
Hashish
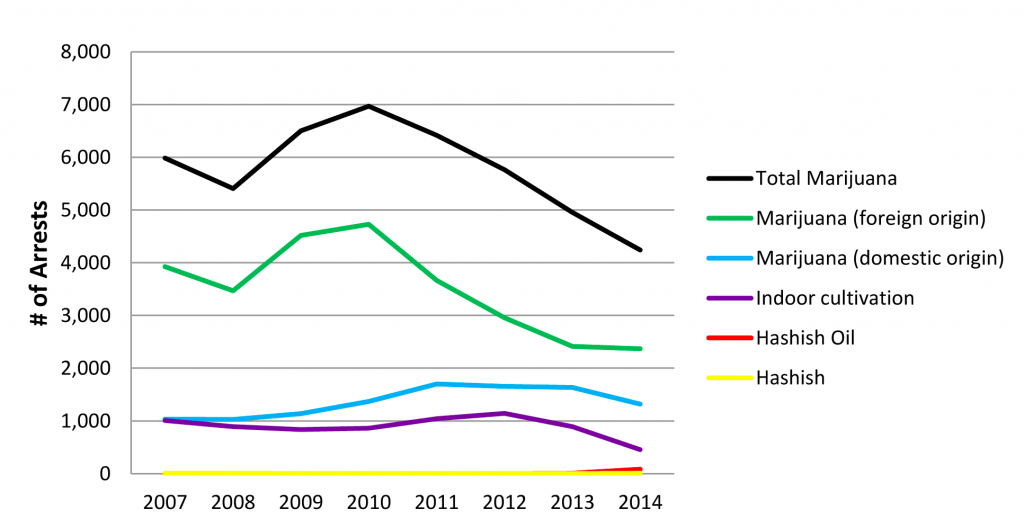
Foreign-produced marijuana-related cases peaked in 2010, and have since steadily declined. Arrests for foreign-produced marijuana remain higher than arrests for domestically-produced marijuana, although they have continued to decline from their peak in 2010. The number of arrests in domestically-produced marijuana investigations has also declined. This decline in marijuana arrests, in particular those for domestic marijuana, and marijuana cases is due in part to state-approved marijuana measures. (See Chart 28.)
(U) Chart 28. DEA Domestic Marijuana Arrests FY2007 to FY2014 Source: DEA
Federal Legality and State-Approved Marijuana Measures
In the United States, marijuana is a Schedule I substance under the CSA [Controlled Substance Act], making it a federal crime to grow, possess, or distribute marijuana and to open, rent, or maintain a place of business for any of these purposes.
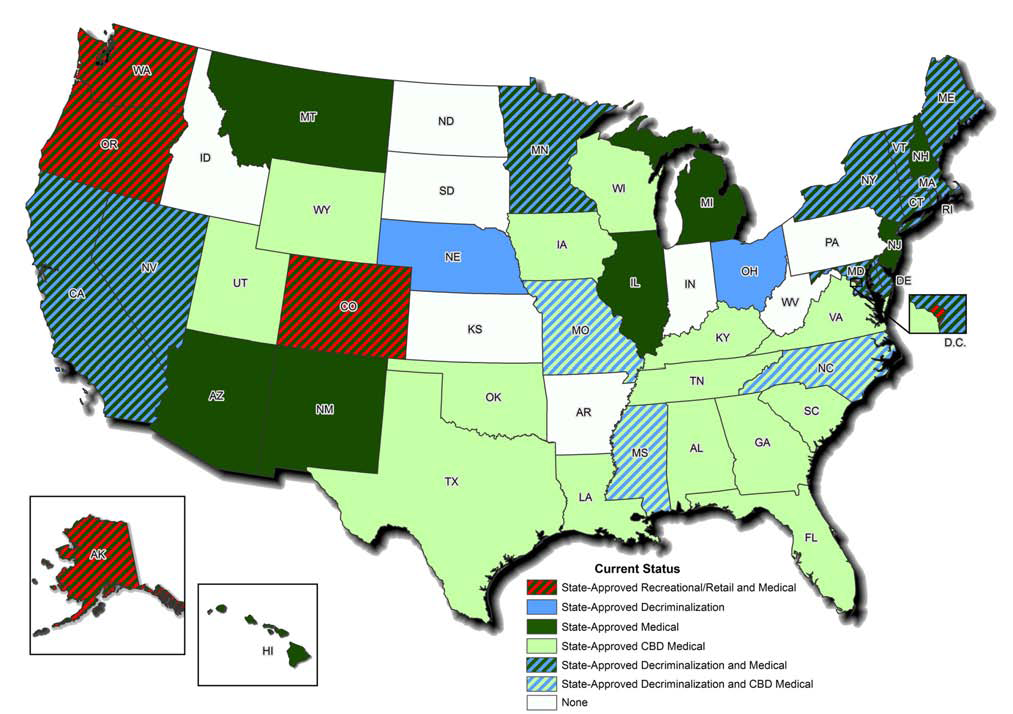
In 1973, many states began decriminalizing marijuana. Decriminalization typically means possession of small amounts of marijuana incur no jail time, but a minor penalty or fine is assessed. Currently, 20 states and the District of Columbia have decriminalized marijuana. (See Map 13.)
(U) Map 13. Current Marijuana Legal Status– October 2015 Source: DEA
State approved recreational retail and Medical [sic the FDA advises there is no such medical use]
State Approved Decriminalization
State-Approved Medical [sic the FDA advises there is no such medical use]
State-Approved CBD Medical [sic the FDA advises there is no such medical use]
State-Approved Decriminalization and Medical [sic the FDA advises there is no such medical use]
State-Approved Deciriminalization and CBD Medical [sic the FDA advises there is no such medical use]
None
In 1996, many states began passing medical [sic the FDA advises there is no such medical use] marijuana legislation. Currently, 23 states and the District of Colombia have passed medical [sic the FDA advises there is no such medical use] marijuana legislation. In 2014, states started passing legislation regarding marijuana that is typically referred to as “Limited Access” or “Cannabidiol (CBD)-only medical [sic the FDA advises there is no such medical use] marijuana.” CBD is a cannabinoid/chemical compound of marijuana. CBD marijuana—typically ingested in the form of oils, oil-filled capsules, and tinctures—is extracted from marijuana that contains low levels of tetrahydrocannabinol (THC), and high levels of CBD.
Many medical marijuana advocates and parents of children with epilepsy claim that CBD [67] helps control epileptic seizures, but at this time there is only anecdotal evidence that CBD benefits those with seizure disorders. [Editor’s comment. The DEA is outside its expertise to imply benefits for seizure disorders. Evaluation of such benefits, if any, are the responsibility of the FDA pursuant to the Pure Food, Drug, and Cosmetic Act, and the FDA’s purpose is to advise on safety and efficacy. As noted in Parts 31, 34, and 38 of this health series, the FDA has ruled again ‘’ marijuana does not have any accepted medical use.’’ https://www.utahstandardnews.com/part-thirty-one-marijuana-as-schedule-one-of-the-controlled-substances-act-for-abuse-no-accepted-medical-use-high-potential-for-abuse-and-lack-of-accepted-safety/, and
https://www.utahstandardnews.com/part-34-marijuana-status-of-research-into-the-medical-use-dea-fda-hhs-california-center-for-medicinal-cannabis-research/ [FDA [FOOD AND DRUG ADMINISTRATION] approves medical use of a drug following a submission and review of an [NEW DRUG APPLICATION] NDA or [BIOLOGICS LICENSE APPLICATION] BLA. The FDA has not approved any drug product containing marijuana for marketing. , a drug may have a “currently accepted medical use” in treatment in the United States if the drug meets a five part test. 1. the drug’s chemistry must be known and reproducible, 2. adequate safety studies, 3. well-controlled studies proving efficacy, 4. accepted by qualified experts, 5. scientific evidence must be widely available. “In the absence of NDA [New Drug Application] approval, information concerning the chemistry, pharmacology, toxicology, and effectiveness of the substance must be reported, published, or otherwise widely available, in sufficient detail to permit experts, qualified by scientific training and experience to evaluate the safety and effectiveness of drugs, to fairly and responsibly conclude the substance is safe and effective for use in treating a specific, recognized disorder.” Marijuana does not meet any of the five elements necessary for a drug to have a “currently accepted medical use.”
and
In addition to the 23 states with medical marijuana laws, 17 other states have approved legislation regarding CBD-only marijuana, which means 80 percent of states have approved some form of medical marijuana. [See Food and Drug Administration letter of 25 June 2015 as to why marijuana is not a medicine, to wit, it damages the brain, and causes other injuries.]

Washington and Colorado passed legislation in 2012 to allow for the cultivation and sale of “retail” or “recreational” marijuana. Sales of marijuana began in Colorado on January 1, 2014 and in Washington on July 8, 2014. In November 2014, Oregon and Alaska passed legislation to allow the cultivation and sale of retail/recreational marijuana, but, to date, sales have not begun. Also in November 2014, Washington, DC passed legislation to allow cultivation and possession of marijuana; however, retail or recreational sales of marijuana are not yet approved.
Increasing THC Potency of Marijuana
The two main cannabinoids of the cannabis plant are delta-9-tetrahydrocannabinol (THC) and cannabidiol (CBD). CBD has recently gained media attention for possible health benefits to those suffering from seizures; however, analysis of marijuana seized by law enforcement indicates it has very low levels of CBD.
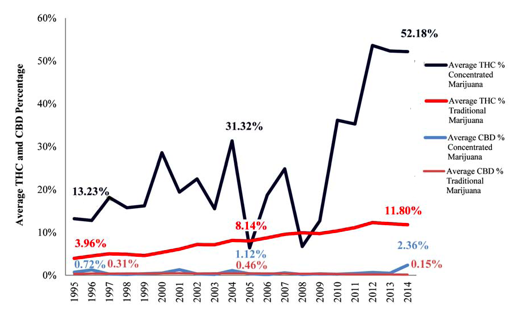
The average THC content of seized marijuana continues to increase. In 1995, the average THC potency of traditional leafy marijuana seizures was around 4 percent; the average THC potency was 12.05 percent in 2013. Partial year data for 2014 indicate the average THC potency in 2014 (11.80%) was consistent with 2013.xxi To date, only 298 traditional marijuana seizures have been analyzed for 2014. When the final 2014 numbers become available this percentage (11.80%) is likely to change slightly. For example, in 2013, there were 1,093 seizures analyzed and the average THC potency was 12.05 percent, and the average CBD potency was 0.17 percent.
The highest level of THC tested for traditional marijuana by the University of Mississippi’s Potency Monitoring Program (PMP) was 37 percent. The average THC content of marijuana concentrate seizures, referred to as “hash-oil,” has also increased significantly. In 1995, the average THC of “hash-oil” was 13.23 percent; in 2013, the average THC potency of “hash-oil” was 52.32 percent, with some seizures testing above 80 percent. Again, partial year data indicate potency levels for 2014 (52.18%) were similar to 2013.xxii The average marijuana concentrate/hash oil is over four times more potent that the average traditional leaf marijuana. (See Chart 29.)

(U) Chart 29. Potency Monitoring Program– Average THC and CBD Potency, Marijuana Seizures 1995 – 2014 Source: University of Mississippi, Potency Monitoring Program, Quarterly Report 127
Use Marijuana
Marijuana is the most commonly used illicit drug in the United States, with an estimated 19.8 million current (past month) users in 2013, according to NSDUH. Marijuana was used by 80.6 percent of the total number of current illicit drug users.
Reported marijuana use among middle and high school students decreased from 2013 to 2014 for lifetime, annual, and monthly use, after steadily increasing over the previous five years. Marijuana use among those over the age of 18 has increased as indicated by both the NSDUH and MTF data sets.
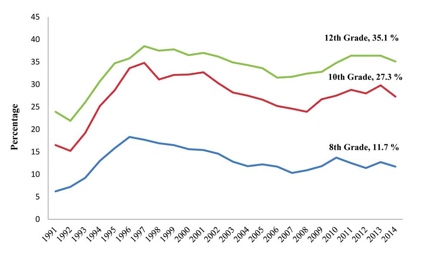
In 2014, nearly 6.0 percent of 12th graders reported daily marijuana use, 21.2 percent reported past month use, and 35.1 percent reported annual use. (See Chart 30.) Of the 12th graders who reported annual use, 40 percent of the students in states with medical marijuana used marijuana edibles compared to 26 percent of those students in states without medical marijuana.
(U) Chart 30. Annual Prevalence of Marijuana Use Among 8th, 10th, and 12th Grade Students, 1991 – 2014 Source: Monitoring the Future
Marijuana use among young adults in college is increasing. In 2006, 30 percent of the nation’s college students said they used marijuana in the previous year, whereas in 2013 nearly 36 percent reported previous year use. Daily or near-daily use of marijuana, defined as 20 or more occasions of use in the prior 30 days, rose from 3.5 percent in 2007, to 5.1 percent in 2013.
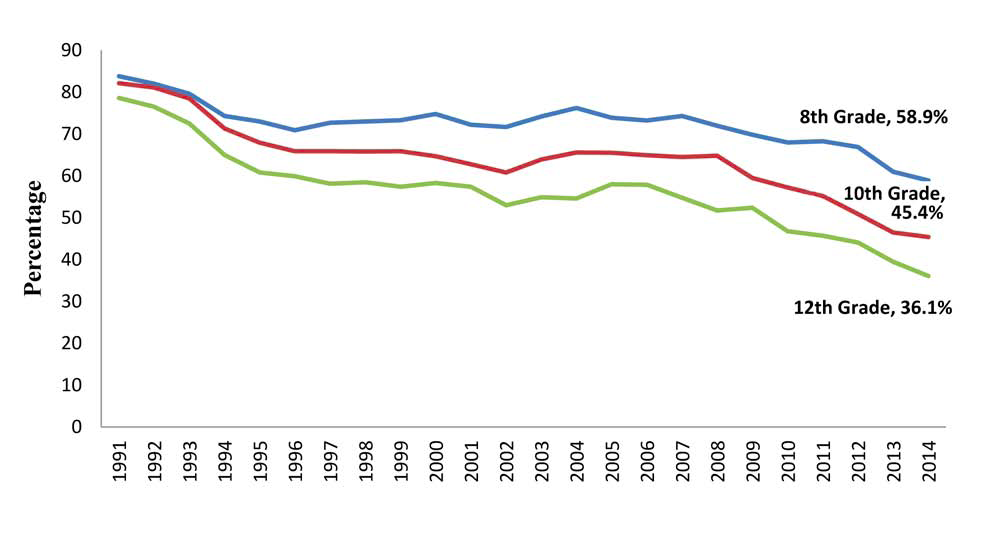
Disapproval of marijuana use, and perception of marijuana being harmful, significantly declined for those in middle and high school. In 2014, only 36.1 percent of 12th graders viewed regular marijuana use as harmful; this was a 3.4 percent decline from 2013, and an 18.5 percent decline from 2004. (See Chart 31.)
(U) Chart 31. Perception Among 8th, 10th, and 12th Grade Students of Regular Marijuana Use Being Harmful, 1991 – 2014 Source: Monitoring the Future
Marijuana use continues to exceed tobacco use in all three MTF grade levels. In 2014, 21.2 percent of 12th graders used marijuana in the past 30 days compared with 13.6 percent who smoked cigarettes. The 2014 MTF survey was the first to ask students about their use of electronic cigarettes, and 17.1 percent of 12th graders said they had used electronic cigarettes in the past 30 days; however, the substances they used inside of the electronic cigarettes was not reported.
(U) Social Media and Marijuana Use
Social media reflects how younger people perceive marijuana use as evidenced by various Internet searches that demonstrate minors using marijuana publicly and with impunity. Social media users of all ages, but primarily younger individuals, have posted hundreds of thousands of photos of themselves with marijuana products on various social media sites; these photos are associated with hashtags that represent marijuana (e.g. #420, #710, #BHO, #dabs). In 2014, approximately 1,200 new photos and videos were posted to Instagram® each day associated with the hashtag #BHO, a slang term for marijuana concentrates.
In November 2014, after the success of a popular online challenge xxiii, [The “ice bucket challenge” benefiting amyotrophic lateral sclerosis (ALS) research..] another social media challenge was issued for people to post photos and videos of themselves using marijuana in public places with the corresponding hashtag #loudchallenge. In response to the challenge, people have posted videos of themselves using marijuana in restaurants, in airports, on public transportation, and in classrooms. To date, only 13 “hash-oil” seizures have been analyzed for 2014. When the final 2014 numbers become available this percentage is likely to change. In 2013, 29 seizures were analyzed and the average THC potency for 2013 was 52.32 percent; the average CBD potency was 0.50 percent.
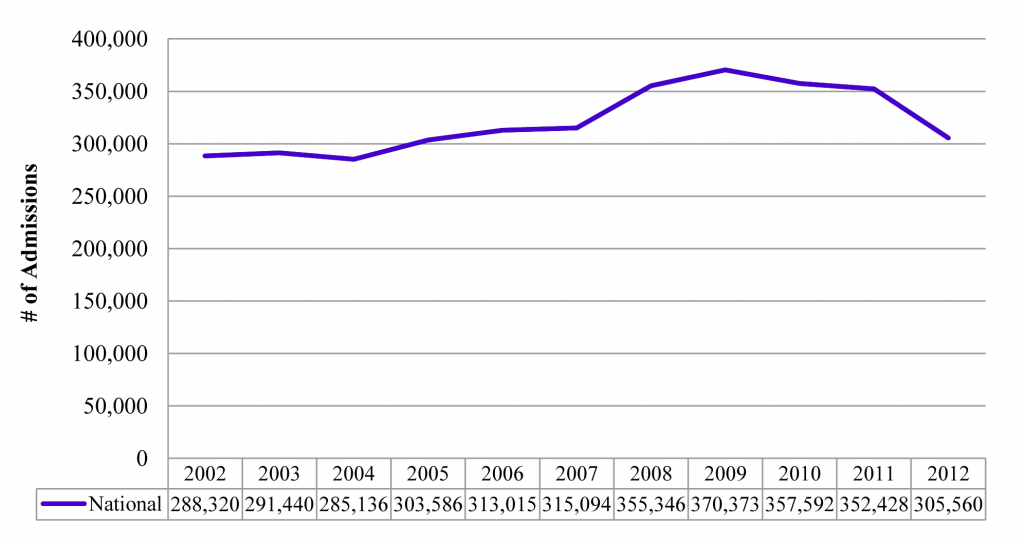
Marijuana accounts for a significant portion of treatment admissions in the United States. According to TEDS, In 2012, 17 percent of all treatment admissions to publicly funded facilities [70] were marijuana-related, up from 15 percent in 2002. Nationally, there was a 6 percent increase in the number of treatment admissions for marijuana from 2002 to 2012; however, between 2011 and 2012 that number declined 13 percent. (See Chart 32.) Treatment admissions for marijuana were less likely than all other drugs to be reported as self or individual referrals; criminal justice referrals accounted for 51.6 percent of marijuana treatment admissions.

(U Chart 32. Marijuana Treatment Admissions for the United States, 2002 – 2012 Source: Treatment Episode Data Set
• Marijuana is the most common substance for treatment admissions among adolescents. In 2012, 76 percent of people between the ages of 12 and 17 admitted to treatment for substance abuse were admitted for marijuana use.
Production – Marijuana
Foreign Production
Marijuana is smuggled into the United States from Mexico in large volumes, with comparatively smaller volumes from Canada and the Caribbean. Marijuana that is smuggled from Mexico is typically classified as “commercial-grade” or “low-grade” marijuana. The quality of marijuana produced in Mexico and the Caribbean is thought to be inferior to the marijuana produced domestically in the United States, or in Canada; however, law enforcement reporting indicates that Mexican cartels are attempting to produce higher-quality marijuana to keep up with US demand for high-quality marijuana.
There was a 23.6 percent decline in the total weight of marijuana seizures along the Southwest Border from 2013 to 2014, according to CBP data. The reasons for this decline are not well defined and remain unclear; cartel intentions and the possible impact of domestic legalization initiatives are continuing intelligence gaps relative to the levels of Mexican marijuana entering the United States. It should be noted that Mexico remains the most significant foreign source for marijuana in the United States and, despite the decline, marijuana seizures along the Southwest Border totaled over 984,600 kilograms in 2014.
Most of the marijuana seized by CBP occurs in the Tucson, Arizona, “West Desert Corridor,” which is controlled by the Sinaloa Cartel. CBP seized the second largest amount of marijuana in the Rio [71] Grande Valley, Texas, corridor, which is controlled primarily by the Gulf Cartel. (See Map 14.)
(U) Map 14. CBP Marijuana Seizures by Southwest Border Corridor in 2014, with Percent Change from 2013. Source: DEA and US Customs and Border Protection
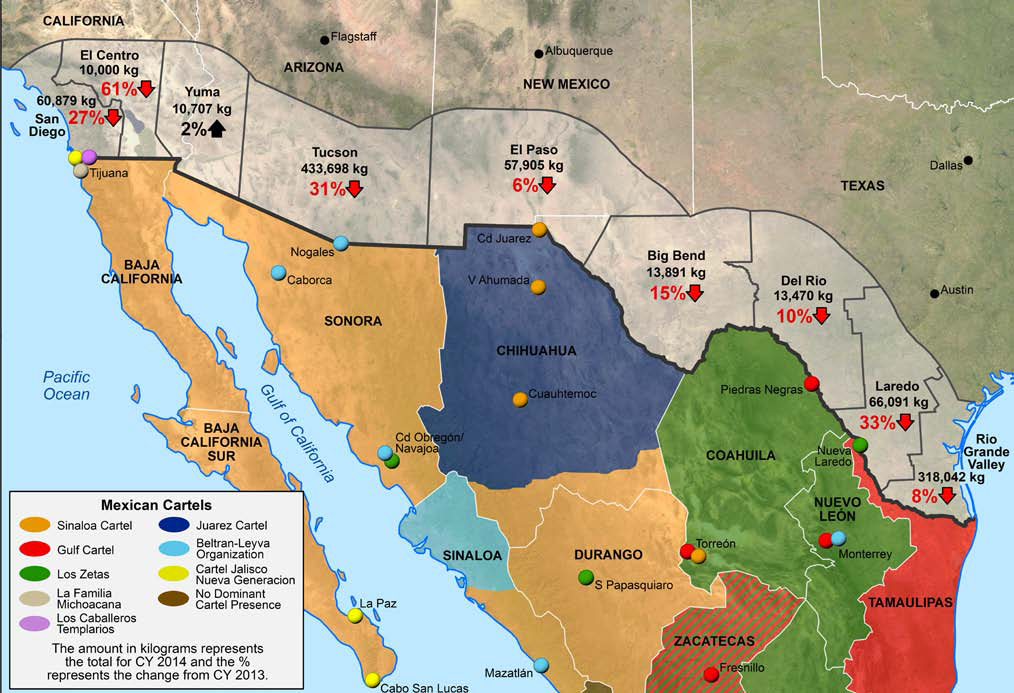
Mexican Cartels Sinaloa Cartel, Gulf Cartel, Los Zelas, La Familia Michiacana, Los Caballeros Templarios, Juarez Cartel, Beltran-Leyva Organization, Cartel Jelisco Nueva Generacion, No dominant Cartel Presnce. The Amount in Kilograms represents the total for CY2014 and the % represents the change from CY 2013. San Diiego 60,679 kg, El Centro 10,000 kg, Yuma 10,707 kg, Tucson 433,698 kg, El Paso 57,905 kg, Big Bend 13,891 kg, Del Rio 13,470 kg, Laredo 66,091 kg, Rio Grande Valley 318,042 kg. [kg = kilogram,, Each Kilogram metric is about 2 ½ pounds English.]
Domestic Production
Although marijuana is cultivated in all 50 states, the majority of domestically-produced marijuana (that which is produced outside of state-authorized cultivation) comes from California. In 2014, the Domestic Cannabis Eradication Suppression Program (DCE/SP) eradicated 4.3 million plants in the United States; 2.68 million were in California. Marijuana can be grown both outdoors and indoors; indoor production is more difficult for law enforcement to discover and does not rely on climate conditions or seasons. (See Table B10 in Appendix B.) Criminal organizations of all sizes and types are involved in illegal marijuana cultivation in the United States.
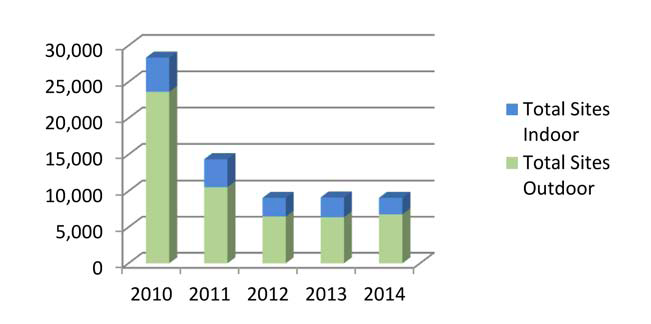
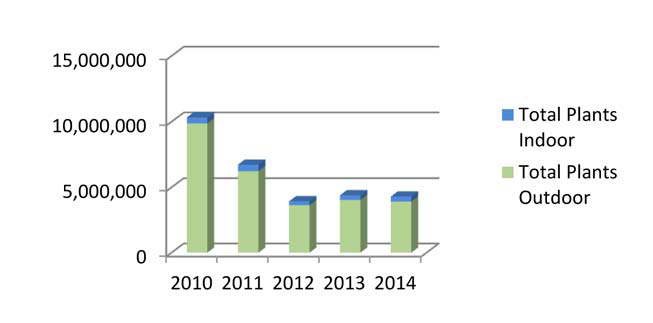
The total number of grow sites eradicated by DCE/ SP declined by 68 percent from 2010 to 2014; the number of eradicated plants declined by 58 percent during that time. (See Charts 33 and 34.) The majority of this decline can be attributed to a 64 percent decrease in eradication in California (7.39 million plants in 2010 to 2.68 million plants in 2014). The decrease was due to several factors: a shift in enforcement priorities due to state-approved marijuana measures, to include the defunding of the California Campaign Against Marijuana Planting (CAMP) in 2012, and the implementation of an automated collection database in 2010, which changed the way seizure statistics were collected.
(U) Chart 33. Total Cannabis Cultivation Sites Eradicated by DCE/SP, CY2010 – CY2014 Source: DEA Domestic Cannabis Eradication/Suppression Program
(U) Chart 34. Total Cannabis Plants Eradicated by DCE/SP, CY2010 – CY2014 Source: DEA Domestic Cannabis Eradication/Suppression Program
72
Marijuana Concentrates
Marijuana concentrates such as hashish, hash oil, and keif have been used for centuries; however marijuana concentrates are gaining popularity in the United States, as indicated by the increasing volume of law enforcement and open source reporting. Street terms for marijuana concentrates include: Butane Honey Oil, BHO, Hash Oil, Dabs/Dabbing, Wax, Shatter, 710, and Errl.
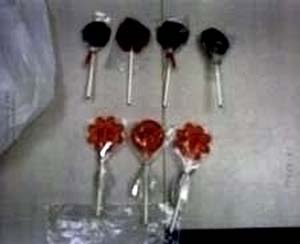
(U) Photo 12. THC-Infused Lollipops
Source: Clovis, California Police Department
Marijuana concentrates are often consumed in e-cigarettes, also known as vaporizers. Marijuana concentrates are also found in other forms such as edibles, topicals, tinctures, capsules, and patches. These new forms of marijuana present a challenge to law enforcement, as they are easier to conceal. (See Photos 12, 13, 14, and 15.)
72
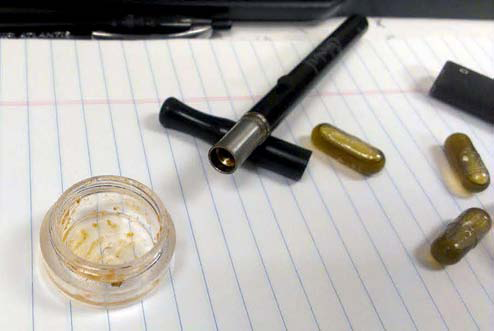
(U) Photo 13. Marijuana Capsules and Vaporizer Source: Southern Maryland Information Center
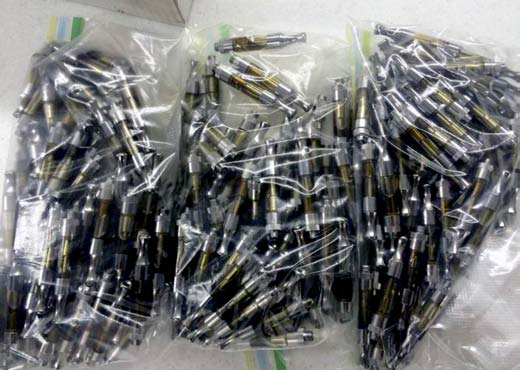
(U) Photo 14. 199 E-Cigarette Cartridges each containing 1.1 milliliters of marijuana concentrates. Source: Lafayette, Louisiana Police Department
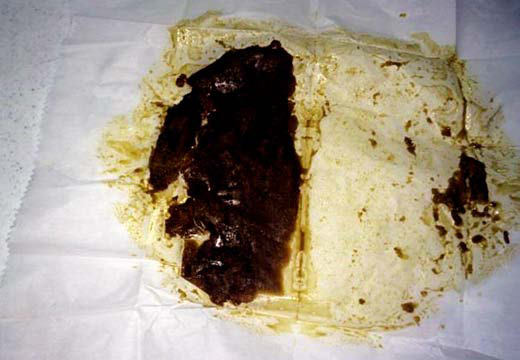
(U) Photo 15. Marijuana concentrates Source: Lafayette, Louisiana Police Department
Marijuana concentrates are extracted from leafy marijuana in many ways, but the most frequently used, and potentially most dangerous, method is butane extraction. The butane extraction method uses highly flammable butane gas and has resulted in numerous explosions and injuries, particularly on the West Coast, where production is most common. The first DEA report of the THC extraction process using butane was in 2005 in Oakland, California. However, as the use of marijuana concentrates has increased, the number of laboratory-related explosions has increased. (See Map 15xxiv)
xxiv The THC extraction laboratories listed were collected from 2014 law enforcement, NSS, and open source news reporting. This list is not meant to be exhaustive. The majority of these laboratories were discovered after a fire/explosion occurred; however, many were discovered upon search warrant entry, thus not all laboratories resulted in an explosion.
[73]
(U) Map 15. THC Extraction Laboratories– 2014 Source: DEA
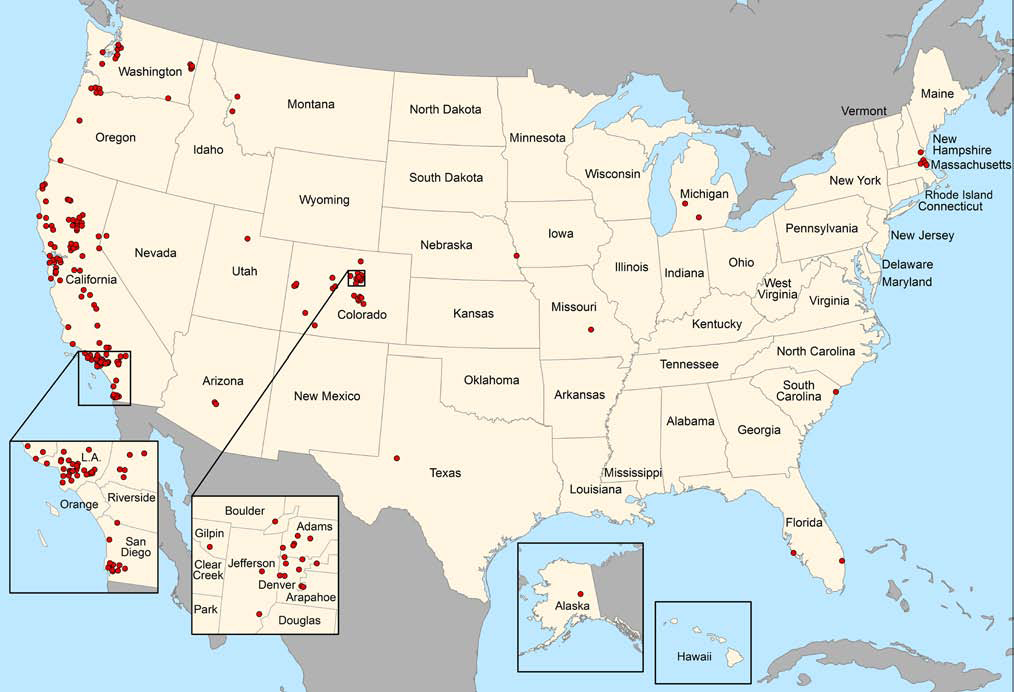
According to the California Drug Endangered Children Training and Advocacy Center (DEC-TAC), there have been 441 THC extraction laboratories recorded in California as of April 6, 2015. Of the total number of laboratories recorded, 291 (66%) were found in 2014; there were 53 laboratories discovered in the first 3 months of 2015. DEC-TAC reports children were present at 72 THC extraction laboratories, resulting in 12 children injured, and the death of 3 children. Further, DEC-TAC reports 140 adults were injured, and 41 adults were killed due to THC extraction laboratory explosions.
(U) THC Extraction Laboratories
The term “THC extraction lab” is used instead of “BHO lab” (for Butane Honey Oil) as butane is not the only solvent used to extract THC from marijuana; DEA has reported the use of propane, Freon®, carbon dioxide (CO2), dry ice, and alcohol (isopropyl and ethanol) in the extraction process. However, butane appears to be the most common solvent used, especially in conjunction with the THC extraction explosions.
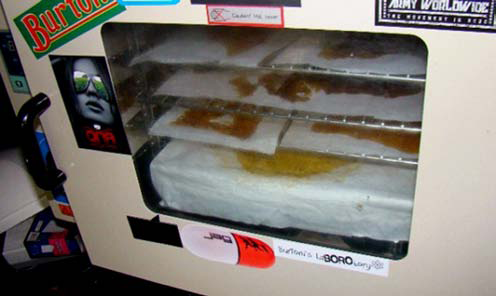
(U) Photo 16. Marijuana concentrates inside of an oven located at a THC extraction laboratory Source: DEA
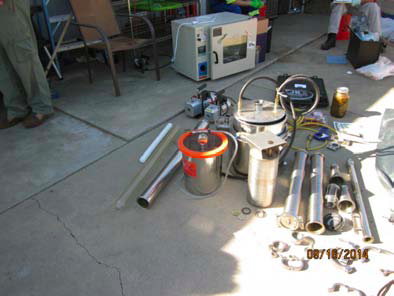
(U) Photo 17. Various THC extraction equipment located at a THC extraction laboratory . Photos source: DEA
Environmental Impact
Illegal outdoor cannabis cultivation sites have a significant, harmful impact on the environment. Marijuana cultivation is associated with illegally diverted water, illegal deforestation, and soil contamination. Additionally, rodenticide and insecticide toxicants are frequently discovered on marijuana cultivation sites and are detrimental to wildlife. Research indicates that each cannabis plant requires roughly 1,200 gallons of water; therefore 500,000 plants would use 600 million gallons of water— enough water to supply the city of San Francisco for approximately three weeks. Over 110,000 acres of land in California have been destroyed since 2006 due to fires associated with illegal marijuana cultivation, costing taxpayers more than $55 million in suppression costs.
• In 2014, the California Department of Fish and Wildlife (CDFW) reported several cases of illegal marijuana cultivation where water was illegally diverted. One case, in May 2014, resulted in the seizure of 4,000 cannabis plants and two tons of waste and hazardous materials; another case, also in May 2014, resulted in the seizure of over 9,000 cannabis plants, and over 2,500 pounds of waste, to include hundreds of pounds of fertilizers and pesticides.
• During 2014, public safety agencies in California reported illegal dumping of hazardous material; thousands of empty butane canisters have been discarded on private and public property. In 2014, the Oakland (California) Fire Department reported that they cleaned up at least two dump sites per week, and most dump sites contain 500 to 800 butane canisters.
[74]UNCLASSIFIED
Transportation and Distribution
Transportation of Foreign-Produced Marijuana
Large quantities of foreign-produced marijuana are smuggled into the United States via personally-owned vehicles, commercial vehicles, buses, subterranean tunnels, rail cargo containers, ultralight aircraft, and maritime vessels. Marijuana smuggled from foreign sources of supply is typically transported in larger shipments than domestically-produced marijuana.
Mexico TCOs smuggle large quantities of marijuana from Mexico into the United States through subterranean tunnels along the Southwest Border. Subterranean tunnels allow traffickers to avoid enforcement activities at POEs. Mexican TCOs may allow independent traffickers to use the tunnels for a fee; however, reporting indicates that the fees are often substantial, such as half the drug proceeds or half the quantity of drugs smuggled. Tunnels discovered by law enforcement are filled with concrete, and the cost to the government to destroy these tunnels can range from $30,000 to hundreds of thousands of dollars.
• Nogales, Arizona: In February 2014, the DEA Nogales RO, in conjunction with ICE, located a 481-foot long subterranean tunnel used to transport drugs into the United States from Nogales, Sonora, Mexico. Officers seized heroin and marijuana at this location.
• Nogales, Arizona: During 2014, the United States Border Patrol (USBP) Nogales, Arizona Station discovered five incomplete tunnels along the Arizona-Mexico border.
• San Diego, California: In April 2014, the San Diego, California Tunnel Task Force (TTF) seized two tunnels located in the Otay Mesa area of San Diego, California. The tunnels contained sophisticated rail and lighting systems and originated at a storage unit facility in Tijuana, Mexico. The TTF arrested two suspects and executed search warrants at separate warehouse locations in the Miramar area of San Diego and Corona, California, and seized approximately 45,000 pounds of marijuana. In May 2014, TTF agents assisted the Tijuana RO with the seizure of an additional tunnel seizure in Tecate, California.
Mexican TCOs continue to send shipments of marijuana via non-commercial maritime vessels from the West Coast of Baja California north to the central California coast. Operators of “pangas”—small, fast-moving vessels—cruise great distances from the California shoreline to avoid law enforcement detection.
• California: In March 2014, law enforcement seized over 6,900 pounds of marijuana and arrested 3 Mexican nationals during a maritime interdiction off the coast of southern California.
• California: In May 2014, a panga boat and a sport utility vehicle were discovered on a beach near Pescadero State Park in California with approximately 1,000 pounds of marijuana.
• California: According to the FY2014: United States Maritime Cross-Border Drug Smuggling assessment, in FY2014, the US Coast Guard (USCG) along with other law enforcement agencies seized 140,000 pounds of marijuana, 88 percent of which–123,000 pounds–was seized from non-commercial vessels on the Pacific Coast. Mexican TCOs smuggle the drug from the Pacific coast of Mexico into California.
• Pharr, Texas: In March 2015, ICE agents in McAllen, Texas, seized 10,120 packages of marijuana weighing over 1,300 kilograms that was comingled and disguised as onions from a warehouse in Pharr, Texas. The marijuana load was destined for North Carolina. (See Photos 18 and 19.)
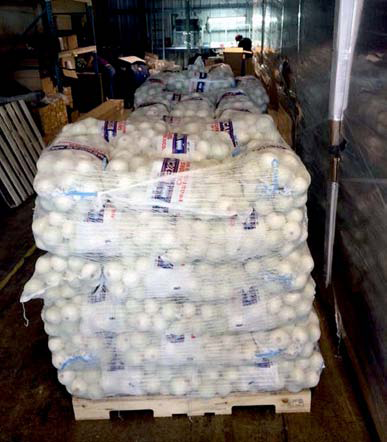
(U) Photo 18. Onion pallet containing “onions” filled with marijuana, Source: Southwest Border HIDTA
Transportation of Domestically-Produced Marijuana
Various TCOs and domestic criminal groups are involved in transporting domestically-produced marijuana. Mexican nationals operate illegal large-scale outdoor marijuana grows, Asian and Cuban criminal organizations operate sophisticated illegal indoor grows, Caucasian criminal organizations operate both large-scale outdoor grows and small-scale indoor grows, and other criminal groups obtain large quantities of marijuana from state authorized entities for illegal resale. Domestically-produced marijuana is typically trafficked from the West Coast—particularly from states with robust “medical marijuana” [sic the FDA advises ‘’marijuana does not have any accepted medical use’’]or “recreational” marijuana laws—to states on the East Coast and in the Southeast.
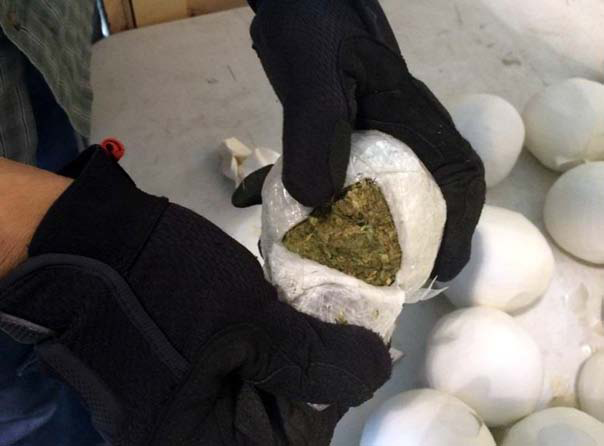
(U) Photo 19. “Onions” filled with marijuana Source: Southwest Border HIDTA
DEA reporting indicates marijuana shipments via commercial parcel delivery services have increased throughout the United States. Multiple online blogs, forums, and Internet sites explain how to ship marijuana so as to avoid law enforcement detection. There is also a website that claims to provide legal advice, Federal Bureau of Investigation (FBI) and US Postal Service (USPS) insider information, labeling, and packaging secrets. CBP data indicate traffickers are using express consignment to transport shipments of marijuana and other drugs throughout the United States. Express consignment seizures in the United States increased 58 percent between FY 2011 and FY 2014.
Outlook
Marijuana will remain abundant in the United States; use will remain high and will increase as perceptions of the drug’s harmfulness diminish. State legalization, and the shifting of law enforcement priorities in many localities, will allow small-scale domestic criminal organizations to cultivate and traffic marijuana with more freedom than in the past. Mexican TCOs will continue to cultivate and traffic marijuana into the United States, and may attempt to cultivate higher-quality marijuana to compete with US demand for high-quality marijuana.
77
Marijuana
Disclaimer: The author of each article published on this web site owns his or her own words. The opinions, beliefs and viewpoints expressed by the various authors and forum participants on this site do not necessarily reflect the opinions, beliefs and viewpoints of Utah Standard News or official policies of the USN and may actually reflect positions that USN actively opposes. No claim in public domain or fair use. © Edmunds Tucker. UTopiAH are trade marks of the author. Utopia was written in 1515 by Sir Thomas More, Chancellor of England.
[2015 Drug Threat Assessment continues next at Part 86 Synthetic Designer Drugs]
Utah Standard News depends on the support of readers like you.
Good Journalism requires time, expertise, passion and money. We know you appreciate the coverage here. Please help us to continue as an alternative news website by becoming a subscriber or making a donation. To learn more about our subscription options or make a donation, click here.
To Advertise on UtahStandardNews.com, please contact us at: ed@utahstandardnews.com.
Comments - No Responses to “Part 85 United States Drug Enforcement Administration Releases 2015 National Drug Threat Assessment Summary of Marijuana, death of 3 children, 41 adults killed, smuggling Mexico, Canada, the Caribbean, Butane Honey Oil, BHO, Hash Oil, Dabs / Dabbing, Wax, Shatter, 710, and Errl. Marijuana remains an illegal substance. DEA ICE FDA”
Sure is empty down here...